After shipping 50+ mobile apps, I’ve implemented Firebase Analytics, Mixpanel, and Amplitude across everything from bootstrapped MVPs to apps with millions of users. The choice between these platforms shapes how you understand user behavior, optimize conversion funnels, and make product decisions. Here’s what actually matters when choosing your analytics stack in 2024.
The analytics landscape has evolved significantly. Firebase Analytics has matured beyond its Google Analytics for Mobile origins, Mixpanel has doubled down on product analytics with better retention tools, and Amplitude has become the go-to for serious growth teams. But implementation complexity, pricing models, and feature sets differ dramatically—choosing wrong can mean months of technical debt or analytics you don’t trust.
The Three Platforms: Core Positioning
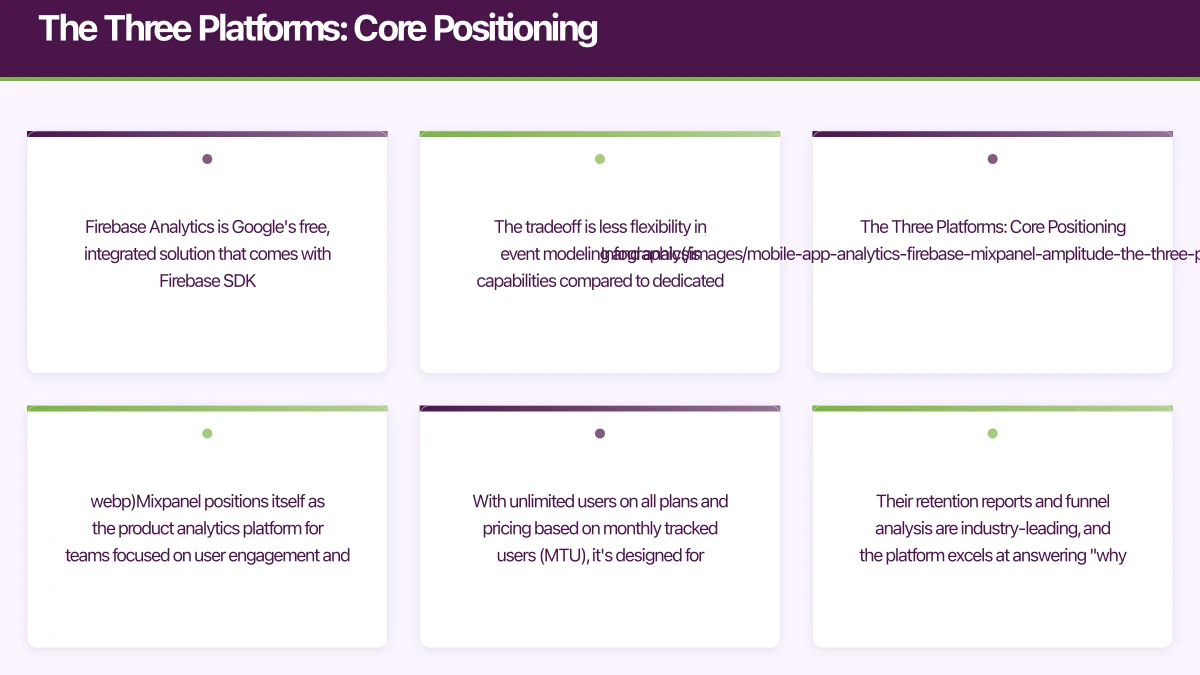
Firebase Analytics is Google’s free, integrated solution that comes with Firebase SDK. It’s designed for developers who want automatic event tracking, seamless Google Ads integration, and unlimited events without worrying about pricing tiers. The tradeoff is less flexibility in event modeling and analysis capabilities compared to dedicated product analytics platforms.
Mixpanel positions itself as the product analytics platform for teams focused on user engagement and retention. With unlimited users on all plans and pricing based on monthly tracked users (MTU), it’s designed for consumer apps with high user volumes. Their retention reports and funnel analysis are industry-leading, and the platform excels at answering “why did users drop off” questions.
Amplitude targets growth-focused product teams with sophisticated analytics needs. Their free tier includes 10 million events per month, making it accessible for early-stage startups, while their paid plans unlock behavioral cohorting, predictive analytics, and data taxonomy management. Amplitude’s query performance with large datasets outpaces competitors—I’ve seen sub-second query times on billions of events.
Implementation:
 Getting Started
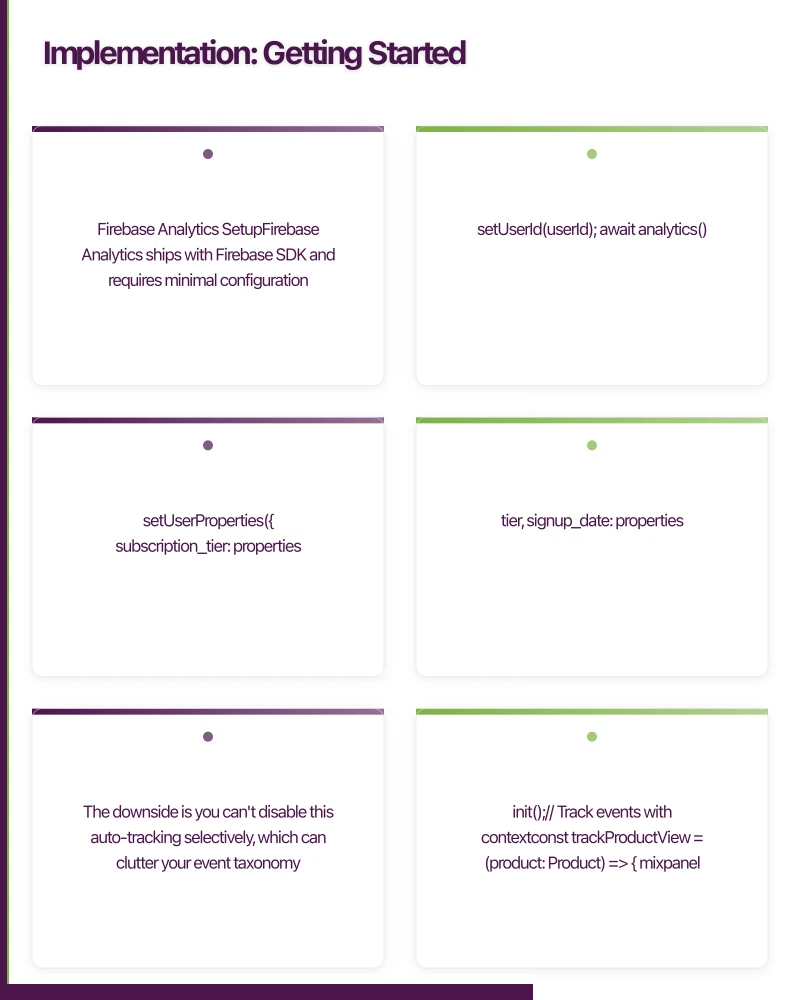
Firebase Analytics Setup
Firebase Analytics ships with Firebase SDK and requires minimal configuration. Here’s a React Native implementation:
// Install Firebase
// npm install @react-native-firebase/app @react-native-firebase/analytics

import analytics from '@react-native-firebase/analytics';

// Track screen views automatically
useEffect(() => {
  analytics().logScreenView({
    screen_name: 'HomeScreen',
    screen_class: 'HomeScreen',
  });
}, []);

// Track custom events
const trackPurchase = async (productId: string, value: number) => {
  await analytics().logEvent('purchase', {
    product_id: productId,
    value: value,
    currency: 'AUD',
    transaction_id: generateTransactionId(),
  });
};

// Set user properties
const identifyUser = async (userId: string, properties: UserProperties) => {
  await analytics().setUserId(userId);
  await analytics().setUserProperties({
    subscription_tier: properties.tier,
    signup_date: properties.signupDate,
    country: 'AU',
  });
};
Firebase Analytics automatically tracks some events (first_open, session_start, screen_view with proper navigation setup), reducing implementation time. The downside is you can’t disable this auto-tracking selectively, which can clutter your event taxonomy.
Mixpanel Setup
Mixpanel requires more deliberate event planning but gives you complete control:
// Install Mixpanel
// npm install mixpanel-react-native

import { Mixpanel } from 'mixpanel-react-native';

const trackingId = 'YOUR_MIXPANEL_TOKEN';
const mixpanel = new Mixpanel(trackingId);
await mixpanel.init();

// Track events with context
const trackProductView = (product: Product) => {
  mixpanel.track('Product Viewed', {
    product_id: product.id,
    product_name: product.name,
    category: product.category,
    price: product.price,
    currency: 'AUD',
    source: 'search', // where the user found this product
  });
};

// Identify users and set properties
const identifyUser = (userId: string, email: string) => {
  mixpanel.identify(userId);
  mixpanel.getPeople().set({
    $email: email,
    $created: new Date().toISOString(),
    subscription_status: 'trial',
    plan: 'starter',
  });
};

// Track super properties (sent with every event)
mixpanel.registerSuperProperties({
  app_version: '2.1.0',
  platform: Platform.OS,
  environment: __DEV__ ? 'development' : 'production',
});
Mixpanel’s profile properties are powerful—you can segment users by any combination of properties and see how behavior changes across cohorts. This is where Mixpanel shines compared to Firebase.
Amplitude Setup
Amplitude’s SDK is lightweight and performant, with excellent TypeScript support:
// Install Amplitude
// npm install @amplitude/analytics-react-native

import { init, track, Identify, identify } from '@amplitude/analytics-react-native';

// Initialize with options
init('YOUR_AMPLITUDE_API_KEY', {
  defaultTracking: {
    sessions: true,
    appLifecycles: true,
    deepLinks: true,
    screenViews: false, // we'll track these manually
  },
});

// Type-safe event tracking
interface PurchaseEventProperties {
  product_id: string;
  revenue: number;
  quantity: number;
  category: string;
}

const trackPurchase = (properties: PurchaseEventProperties) => {
  track('Purchase Completed', properties);
};

// User properties with Identify API
const updateUserProfile = (userId: string) => {
  const identifyObj = new Identify();
  identifyObj.set('user_type', 'premium');
  identifyObj.setOnce('initial_signup_date', '2024-05-18');
  identifyObj.add('total_purchases', 1);

  identify(identifyObj, userId);
};

// Revenue tracking
const trackRevenue = (amount: number, productId: string) => {
  track('Revenue', {
    revenue: amount,
    productId: productId,
    revenueType: 'subscription',
  });
};
Amplitude’s Identify API is more sophisticated than Mixpanel’s—the setOnce, add, append operations let you build rich user profiles without overwriting previous values. This matters when tracking cumulative metrics like total_purchases or lifetime_value.
Feature Compariso
 n: What You Actually Get
Event Tracking and Data Model
Firebase Analytics limits you to 500 distinct event types and 25 user properties. Event parameters are limited to 100 per event. For most apps, this is sufficient, but I’ve hit these limits on complex e-commerce and fintech apps where tracking product attributes and user segments requires more granularity.
Mixpanel has no hard limits on event types or properties, but their UI becomes unwieldy with hundreds of events. Their strength is in property-based segmentation—you can slice any event by any property combination. The event data model supports nested properties, which Firebase doesn’t.
Amplitude also has no event limits and handles complex event taxonomies better than Mixpanel through their Data taxonomy feature (paid plans). You can block bad events, merge duplicate properties, and set property types—critical for maintaining data quality as your team grows.
Funnel Analysis
All three platforms offer funnel analysis, but the implementation differs significantly:
Firebase Analytics funnels are basic. You can create multi-step funnels in Google Analytics 4 (where Firebase data flows), but you can’t analyze why users drop off or create holdout groups. Funnels are also limited to 10 steps.
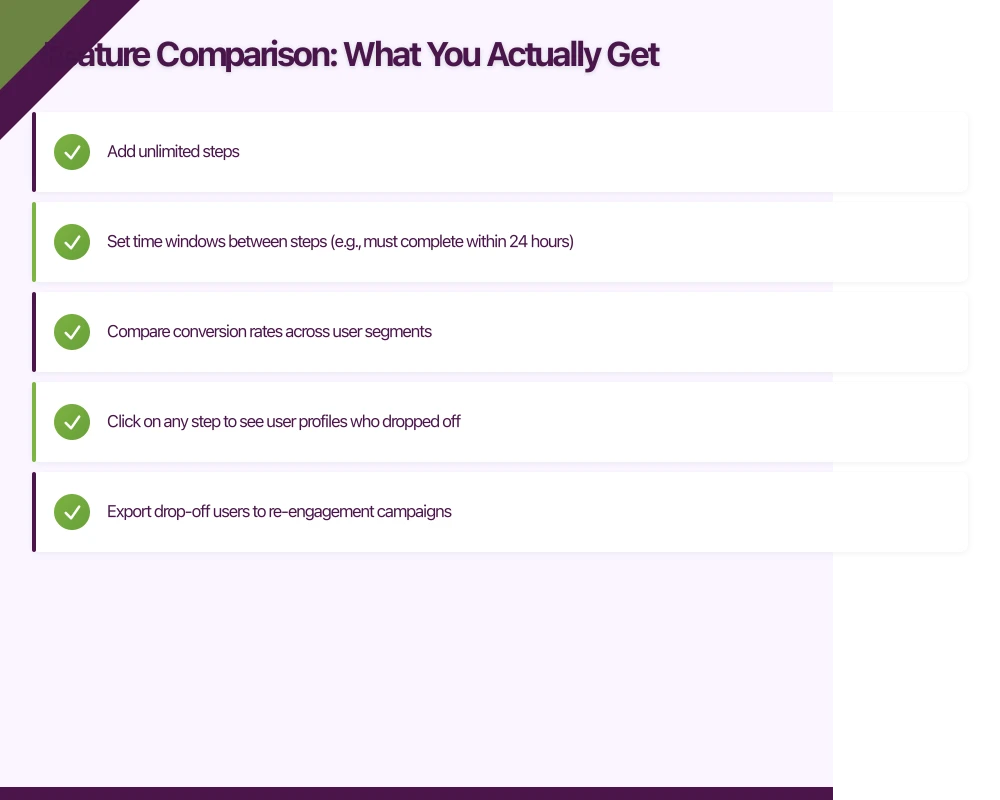
Mixpanel funnels are industry-leading. You can:
- Add unlimited steps
- Set time windows between steps (e.g., must complete within 24 hours)
- Compare conversion rates across user segments
- Click on any step to see user profiles who dropped off
- Export drop-off users to re-engagement campaigns
In practice, Mixpanel’s funnel analysis has helped me identify that users who add a profile photo within 24 hours have 3x higher D7 retention—that’s the kind of insight that shapes your onboarding flow.
Amplitude funnels are equally sophisticated with one key advantage: you can analyze friction points with their Microscope feature, which shows you what users did before dropping off. This behavioral analysis is powerful for complex user journeys.
Retention and Cohort Analysis
Firebase Analytics retention reports are limited to daily, weekly, and monthly views. You can’t customize cohort definitions beyond install date.
Mixpanel excels here. You can define custom retention events (e.g., “user sent a message” rather than just “opened app”), create behavioral cohorts, and analyze retention across any time period. Their retention report UI is the best I’ve used—you instantly see retention curves and can drill into any cohort.
Amplitude takes retention further with their behavioral cohorts and Compass feature, which automatically identifies which user actions correlate with retention. I’ve used this to discover that users who connect with 3+ friends in the first week have 5x better 30-day retention—a metric that became our north star.
User Profiles and Segmentation
Firebase Analytics user properties are basic. You can segment users in Google Analytics 4, but you can’t see individual user profiles or export user lists.
Mixpanel provides detailed user profiles with full event history. You can see exactly what each user did, when, and build segments based on any combination of properties and behaviors. The “Users” tab is invaluable for customer support and debugging.
Amplitude user profiles are similarly detailed, with one advantage: their Persona feature (paid plans) automatically groups users by behavior patterns, helping you discover user segments you didn’t know existed.
Pricing: What You’
 ll Actually Pay
Firebase Analytics
Free. Unlimited events, unlimited users. This is Firebase’s killer advantage. The catch is you’re locked into the Google ecosystem, and advanced features require BigQuery export ($0.01 per GB scanned, which adds up fast with millions of users).
Mixpanel Pricing (May 2024)
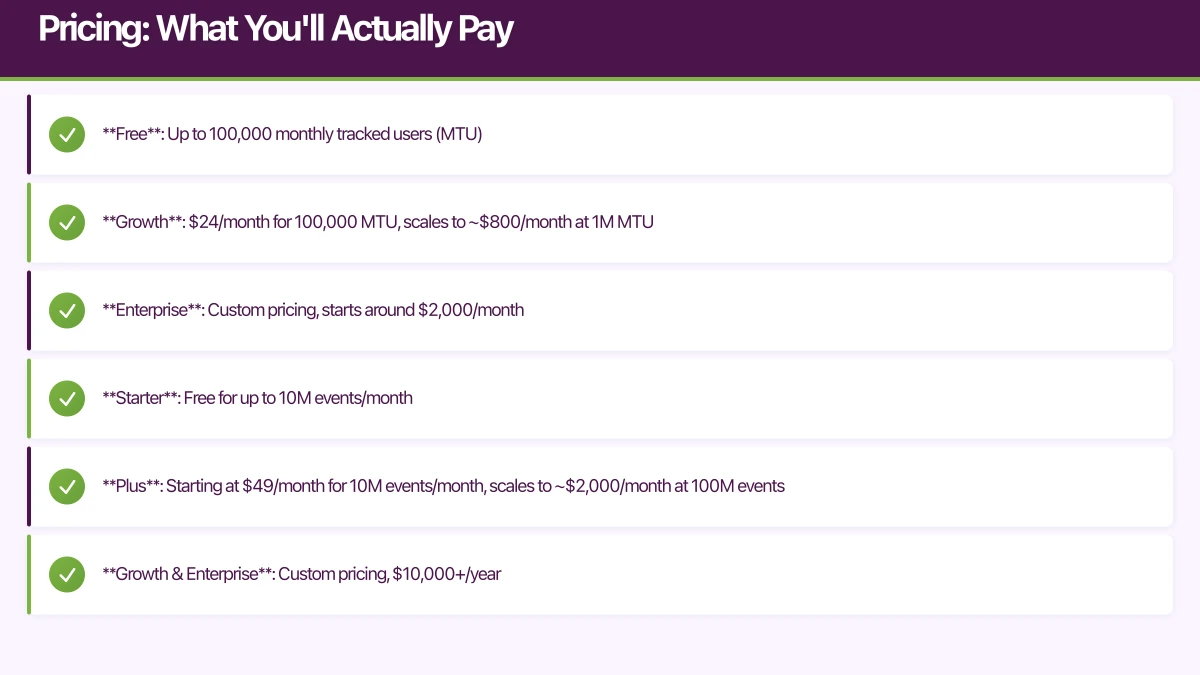
- Free: Up to 100,000 monthly tracked users (MTU)
- Growth: $24/month for 100,000 MTU, scales to ~$800/month at 1M MTU
- Enterprise: Custom pricing, starts around $2,000/month
MTU counting can be tricky—a user who opens your app once in January and once in March counts as 2 MTU total. For consumer apps with high user volumes, this pricing model is favorable compared to event-based pricing.
Amplitude Pricing (May 2024)
- Starter: Free for up to 10M events/month
- Plus: Starting at $49/month for 10M events/month, scales to ~$2,000/month at 100M events
- Growth & Enterprise: Custom pricing, $10,000+/year
Event-based pricing means you pay for engagement volume, not unique users. For apps with highly engaged users (messaging apps, social networks), this gets expensive fast. But for B2B SaaS with fewer users who generate many events, it’s cost-effective.
Real-World Cost Comparison
For a consumer app with 500,000 MAU and 50 million monthly events:
- Firebase: $0
- Mixpanel: ~$400-600/month
- Amplitude: ~$5,000-8,000/month
For a B2B SaaS with 5,000 MAU and 5 million monthly events:
- Firebase: $0
- Mixpanel: Free tier (under 100k MTU)
- Amplitude: Free tier (under 10M events)
Integration and Data Export
Firebase Analytics exports to BigQuery for free (with BigQuery charges). This is huge—you can run custom SQL queries, build dashboards in Looker Studio, and join analytics data with other sources. However, the export schema is nested JSON, which is painful to query.
Mixpanel exports are limited on free and growth plans. You can access raw data via API, but bulk exports require Enterprise plan. Their integrations with tools like Segment, Braze, and Iterable are solid.
Amplitude provides data export on paid plans and has the best integration ecosystem. Their behavioral cohorts can sync to ad platforms, email tools, and data warehouses. If you’re building a modern data stack, Amplitude fits more naturally.
Performance and Reliability
Firebase Analytics has occasional delays in event processing (1-4 hours is normal, up to 24 hours during issues). Real-time debugging view helps, but you can’t build real-time features on Firebase Analytics data.
Mixpanel processes events in near real-time (under 1 minute typically). I’ve built in-app dashboards using Mixpanel’s APIs that show live user activity.
Amplitude is similarly fast, with the added benefit that their chart loading is noticeably faster than Mixpanel when querying large datasets. This matters when you’re iterating on analysis—waiting 10 seconds vs 2 seconds per query adds up.
Privacy and Compliance
All three platforms are GDPR and CCPA compliant, but implementation differs:
Firebase Analytics data residency is controlled by your Firebase project region. Google’s data processing is transparent but complex—data flows through multiple Google services.
Mixpanel lets you choose EU or US data residency and has strong privacy controls. Their GDPR deletion tools are straightforward.
Amplitude similarly offers regional data residency and has the most mature data governance features, including data validation rules and schema enforcement.
For Australian apps, all three platforms can be configured to be Privacy Act compliant. The key is implementing proper user consent flows and data retention policies in your app.
Choosing the Right Platform
Choose Firebase Analytics if:
- You’re already using Firebase for backend services
- You need unlimited free analytics
- Your app is early-stage and you prioritize speed over sophistication
- You plan to use Google Ads and want attribution tracking
- You’re comfortable with Google Analytics 4’s interface
I recommend Firebase for MVPs and apps in the first year of development. The zero cost and zero configuration make it perfect for validating product-market fit.
Choose Mixpanel if:
- You need powerful retention and cohort analysis
- Your app has high user volumes but moderate engagement per user
- You want detailed user profiles and behavioral segmentation
- You’re focused on optimizing conversion funnels
- You need real-time analytics data
Mixpanel is the sweet spot for consumer apps and startups focused on growth. The pricing is reasonable until you hit millions of users, and the features are professional-grade.
Choose Amplitude if:
- You’re serious about product analytics and have budget
- You need sophisticated behavioral cohorting and predictive analytics
- Your team is data-driven and will use advanced features
- You’re building a modern data stack with warehouse integration
- You need enterprise features like data governance
Amplitude makes sense for well-funded startups and established companies. The learning curve is steeper, but the insights are deeper.
Implementation Best Practices
Regardless of platform, follow these patterns:
1. Plan Your Event Taxonomy
Before implementing any tracking, document your events:
// events.ts - Single source of truth for analytics events
export const AnalyticsEvents = {
  // Authentication
  SIGN_UP_STARTED: 'Sign Up Started',
  SIGN_UP_COMPLETED: 'Sign Up Completed',

  // Onboarding
  ONBOARDING_STEP_VIEWED: 'Onboarding Step Viewed',
  ONBOARDING_COMPLETED: 'Onboarding Completed',

  // Core Product
  PRODUCT_VIEWED: 'Product Viewed',
  PRODUCT_ADDED_TO_CART: 'Product Added to Cart',
  CHECKOUT_STARTED: 'Checkout Started',
  PURCHASE_COMPLETED: 'Purchase Completed',
} as const;

// Enforce consistent property naming
export interface ProductViewedProperties {
  product_id: string;
  product_name: string;
  category: string;
  price: number;
  currency: 'AUD';
  source: 'search' | 'recommendation' | 'category' | 'direct';
}
2. Create Analytics Abstractions
Don’t scatter analytics calls throughout your codebase:
// analytics.service.ts
class AnalyticsService {
  private providers: Array<'firebase' | 'mixpanel' | 'amplitude'> = [];

  async init() {
    // Initialize all enabled providers
    if (Config.FIREBASE_ENABLED) {
      await this.initFirebase();
      this.providers.push('firebase');
    }
    if (Config.MIXPANEL_ENABLED) {
      await this.initMixpanel();
      this.providers.push('mixpanel');
    }
  }

  track(event: string, properties?: Record<string, any>) {
    this.providers.forEach(provider => {
      switch(provider) {
        case 'firebase':
          analytics().logEvent(event, properties);
          break;
        case 'mixpanel':
          mixpanel.track(event, properties);
          break;
        case 'amplitude':
          track(event, properties);
          break;
      }
    });
  }
}

export const Analytics = new AnalyticsService();
This abstraction lets you implement multiple providers simultaneously (useful during migrations) and swap providers without changing your app code.
3. Test Analytics in Development
Use debug modes to verify tracking:
// Enable debug mode in development
if (__DEV__) {
  // Firebase: see events in real-time
  await analytics().setAnalyticsCollectionEnabled(true);

  // Mixpanel: see events in console
  mixpanel.setLoggingEnabled(true);

  // Amplitude: use logger plugin
  init(API_KEY, {
    logLevel: LogLevel.Debug,
  });
}
I’ve caught countless tracking bugs by checking debug logs before releasing to production.
The Migration Reality
I’ve migrated apps between these platforms multiple times. Here’s what to expect:
Firebase to Mixpanel/Amplitude: Relatively straightforward. Implement the new SDK alongside Firebase, run both for 2-4 weeks to verify data consistency, then remove Firebase. Your historical data stays in Firebase/BigQuery.
Mixpanel to Amplitude (or vice versa): More complex because you’re changing your primary product analytics platform. Plan for 1-2 months of parallel tracking to rebuild key dashboards and verify metrics match. Historical data can sometimes be imported via API, but expect to lose some granularity.
Cost: Budget 40-80 engineering hours for a clean migration, including event taxonomy cleanup, SDK implementation, dashboard rebuilding, and validation.
The Verdict
For most Australian app startups in 2024, I recommend this progression:
Year 1: Start with Firebase Analytics. It’s free, good enough for early product iteration, and you can export to BigQuery when you need custom analysis.
Year 2-3: Migrate to Mixpanel when you have product-market fit and need sophisticated funnel analysis and retention tracking. The cost is manageable for most consumer apps, and the insights directly improve your metrics.
Year 3+: Evaluate Amplitude if you’ve raised Series A+ funding and have a dedicated growth team. The advanced features pay for themselves when you’re optimizing at scale.
The key insight: your analytics platform should match your company stage. Don’t over-engineer analytics in year one, but don’t under-invest once you have users who depend on your product.

Looking Ahead
The analytics space continues to evolve. Firebase is adding more sophisticated analysis tools through GA4 integration, Mixpanel is investing in AI-powered insights to automatically surface anomalies, and Amplitude is expanding their data warehouse integrations to support reverse ETL workflows.
For Australian developers, the emergence of privacy-first analytics platforms like PostHog and June is worth watching. These open-source alternatives offer self-hosting options that may simplify Privacy Act compliance, though they’re not yet mature enough for production use at scale.
The best analytics platform is the one your team actually uses. I’ve seen companies pay $50,000/year for Amplitude and only use 10% of its features, while scrappy startups squeeze incredible insights from Firebase’s free tier. Start simple, instrument carefully, and upgrade when your current platform becomes the bottleneck to understanding your users.
Building your next app? Let’s discuss your architecture and analytics strategy.
Your app’s marketing starts on the web. Cosmos Web Tech designs landing pages with SEO that help potential users find your app online.
Awesome Apps is the mobile development division of Ganda Tech Services, building iOS and Android apps for Australian businesses.
Talk to a Sydney app developer — free.
30 minutes. We'll tell you what your app needs, how long it takes, and what it costs. Real answers, no sales pitch.
Book Free App Strategy Call →Free · 30 minutes · No obligation