Introduction
Without analytics, you’re building in the dark. You don’t know if features get used, where users struggle, or whether changes help or hurt. Analytics provides visibility into how your app actually performs with real users.
This guide covers the fundamentals of mobile app analytics—what to measure, how to implement it, and how to use data effectively.
Why Analytics Matters
Inform Decisions
Analytics answers questions like:
- Which features do users actually use?
- Where do users drop off in key flows?
- How long do users spend in the app?
- What brings users back?
- Is this change improving things?
Data beats opinions in product decisions.
Identify Problems
Analytics reveals issues:
- Crashes and errors
- Performance problems
- UX friction points
- Feature failures
- Conversion blockers
Find problems before they drive users away.
Measure Success
Define and track success:
- Key business metrics
- User engagement
- Growth indicators
- Feature adoption
Know if you’re moving in the right direction.
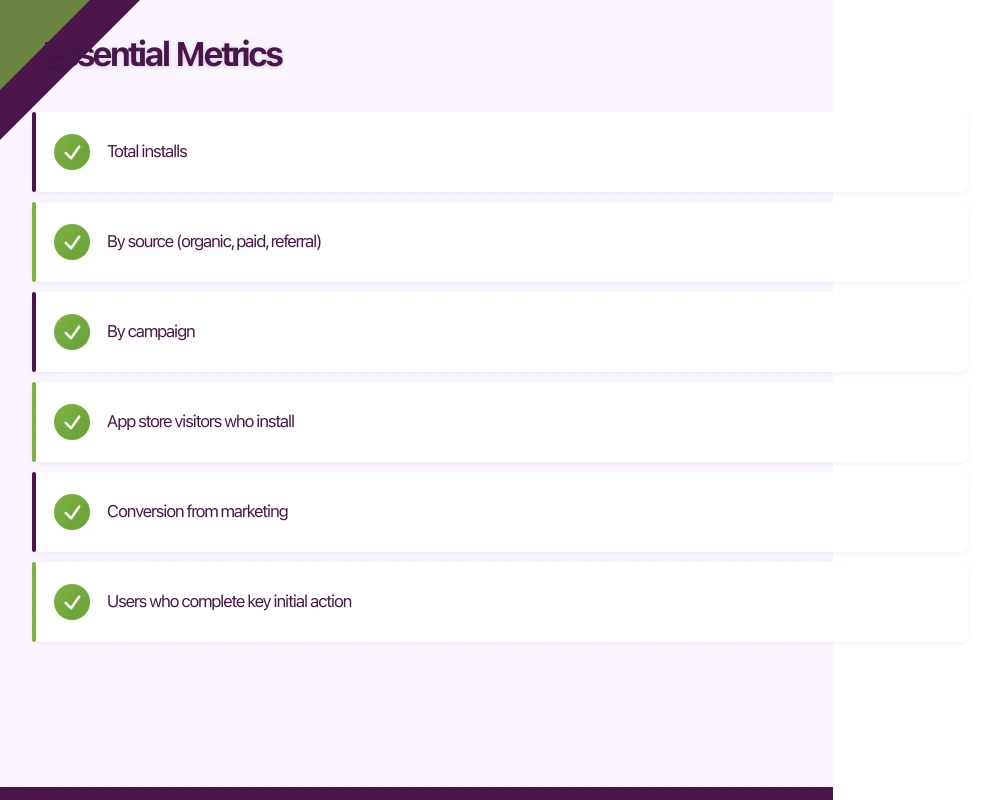
Essential Metrics
Acqui
 sition Metrics
How users find and install your app:
Downloads/Installs
- Total installs
- By source (organic, paid, referral)
- By campaign
Install Rate
- App store visitors who install
- Conversion from marketing
Activation Metrics
Do new users actually start using the app?
Activation Rate
- Users who complete key initial action
- First meaningful engagement
- Onboarding completion
Time to Activate
- How long until first value
- Faster is usually better
Engagement Metrics
How users interact with your app:
Daily Active Users (DAU)
- Unique users per day
- Foundation metric
Monthly Active Users (MAU)
- Unique users per month
- Broader engagement view
DAU/MAU Ratio (“Stickiness”)
- How often monthly users return daily
- Higher = more engaging
Session Metrics
- Sessions per user
- Session length
- Session frequency
Feature Usage
- Which features get used
- Frequency of use
- Feature adoption rate
Retention Metrics
Do users come back?
Retention Rate
- Day 1: Users returning next day
- Day 7: Users returning after week
- Day 30: Users returning after month
Cohort Retention
- Retention by signup cohort
- Shows trends over time
Revenue Metrics (if applicable)
For monetised apps:
Revenue Per User (ARPU)
- Total revenue / total users
Lifetime Value (LTV)
- Total value from a user over their lifetime
Conversion Rate
- Free to paid conversion
- Purchase completion rate
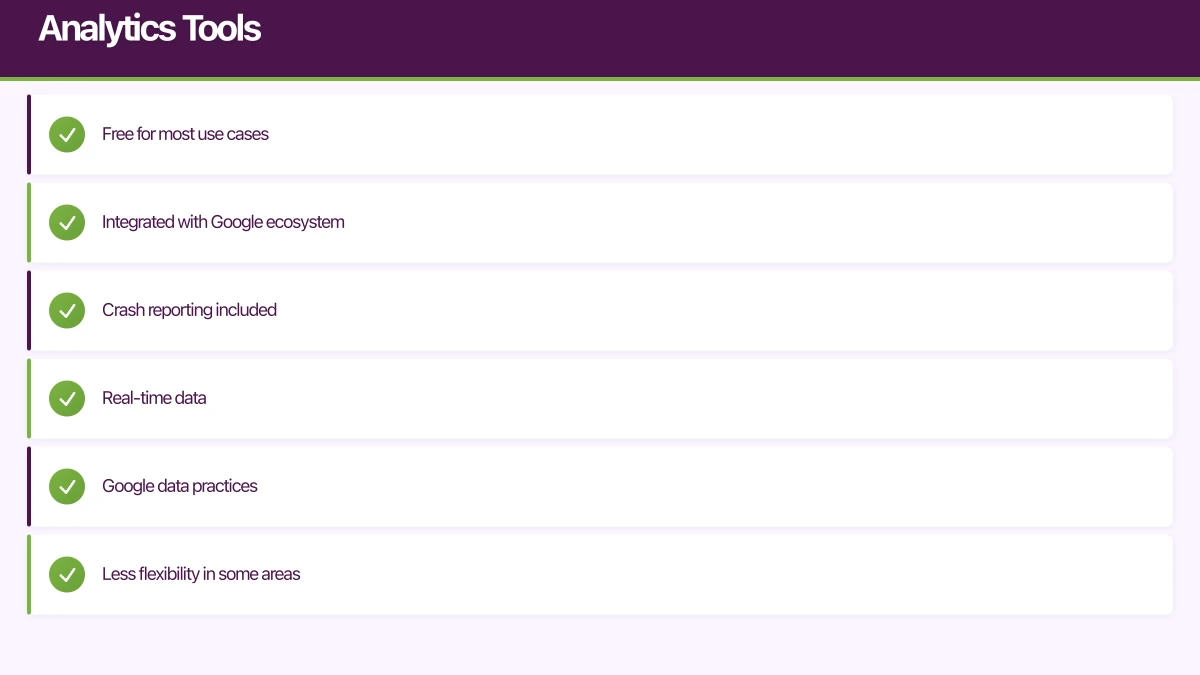
Analytics Tools
Popular Op
 tions
tions
Firebase Analytics (Google)
Pros:
- Free for most use cases
- Integrated with Google ecosystem
- Crash reporting included
- Real-time data
Cons:
- Google data practices
- Less flexibility in some areas
Amplitude
Pros:
- Powerful event analytics
- Good visualisation
- Behavioural cohorts
- Product focus
Cons:
- Pricing at scale
- Learning curve
Mixpanel
Pros:
- Event-based analytics
- Strong retention analysis
- User journeys
Cons:
- Pricing can escalate
- Complexity
App Store Analytics
Pros:
- Source of truth for downloads
- App Store specific data
- Free
Cons:
- Limited behavioural data
- No cross-platform
Choosing a Tool
Consider:
- Budget (many have free tiers)
- Features needed
- Team capability
- Integration requirements
- Data privacy needs
For many apps, Firebase Analytics is a good starting point.
Implementing Analytics
Event Tracking
Track meaningful actions:
What to Track
- Key user actions
- Conversion steps
- Feature usage
- Errors and failures
- Content engagement
Event Naming
Consistent, clear naming:
// Good
button_click
purchase_completed
onboarding_step_completed

// Avoid
btnClk
purchase
step2done
Event Properties
Additional context:
analytics.track('purchase_completed', {
    amount: 29.99,
    currency: 'AUD',
    product_id: 'premium_monthly',
    payment_method: 'credit_card'
});
Screen Tracking
Track which screens users view:
- Automatic screen tracking (if available)
- Manual tracking for custom flows
- Screen names should be meaningful
User Properties
Attributes of users:
- Subscription status
- User type
- Account age
- Platform/device
Enable segmentation of analytics.
Implementation Tips
Start Simple
- Track key events first
- Add more as needed
- Don’t track everything initially
Be Consistent
- Naming conventions
- Property formats
- Documentation
Test Your Tracking
- Verify events fire correctly
- Check properties are accurate
- Debug mode in analytics tools
Using Analytics Data
Building Dashboards
Create views for different needs:
Executive Dashboard
- High-level KPIs
- Trends over time
- Business metrics
Product Dashboard
- Feature usage
- User flows
- Engagement metrics
Technical Dashboard
- Crashes
- Performance
- Errors
Regular Review
Schedule analytics review:
Weekly
- Key metrics check
- Unusual patterns
- Recent changes impact
Monthly
- Trend analysis
- Cohort review
- Deeper investigation
Quarterly
- Strategic review
- Goal assessment
- Long-term trends
Asking Good Questions
Analytics answers questions:
Usage Questions
- What percentage of users use feature X?
- How has usage changed this month?
- Which features do power users prefer?
Funnel Questions
- Where do users drop off in onboarding?
- What’s the conversion rate at each step?
- What improves conversion?
Retention Questions
- Are users coming back?
- What actions correlate with retention?
- When do users typically churn?
A/B Testing
Use analytics for experiments:
- Form hypothesis
- Create variants
- Measure results
- Make decision based on data
Many analytics tools support A/B testing integration.
Privacy Considerations
Regulations
Be aware of:
- GDPR (EU users)
- CCPA (California users)
- Australian Privacy Act
- App store requirements
Best Practices
Consent
- Get proper consent
- Explain data collection
- Allow opt-out
Minimise Data
- Collect what you need
- Avoid sensitive data
- Anonymise where possible
Transparency
- Clear privacy policy
- Explain analytics use
- Accessible controls
Technical Implementation
- Analytics consent flow
- Respect opt-out preferences
- Secure data handling
- Regular compliance review
Common Mistakes
Tracking Everything
Problem: Overwhelming data, no insights.
Solution: Focus on meaningful events. You can add more later.
Vanity Metrics
Problem: Tracking numbers that feel good but don’t matter.
Solution: Focus on metrics that inform decisions.
Ignoring Data
Problem: Collecting data but not using it.
Solution: Regular review cadence, decision-making process.
No Baseline
Problem: No comparison point for changes.
Solution: Establish baselines before making changes.
Over-Reliance
Problem: Data alone makes decisions.
Solution: Combine with qualitative feedback, judgment.
Getting Started
Week 1: Foundation
- Choose analytics tool
- Implement basic SDK
- Enable automatic tracking
- Test implementation
Week 2-3: Core Events
- Identify key events
- Implement tracking
- Add relevant properties
- Verify accuracy
Week 4: Dashboards
- Create key dashboards
- Set up regular reports
- Share with team
- Begin review routine
Ongoing
- Add events as features develop
- Refine tracking based on questions
- Regular review and action
- Continuous improvement
Conclusion
Analytics transforms app development from guessing to knowing. Start with essential metrics. Implement tracking thoughtfully. Review data regularly. Make decisions based on evidence.
You don’t need perfect analytics from day one. Start simple, learn what questions you need answered, and expand your tracking to answer those questions.
The goal isn’t data for its own sake—it’s understanding that leads to better decisions and better apps.
Your app’s marketing starts on the web. Cosmos Web Tech designs landing pages with SEO that help potential users find your app online.
Ashish Ganda is the founder of Ganda Tech Services, a Sydney-based technology consultancy helping Australian businesses grow through cloud, web, and mobile solutions.
Talk to a Sydney app developer — free.
30 minutes. We'll tell you what your app needs, how long it takes, and what it costs. Real answers, no sales pitch.
Book Free App Strategy Call →Free · 30 minutes · No obligation