App Analytics: Measuring What Matters for Growth
Most mobile apps track too many metrics and act on too few. Dashboards filled with vanity numbers create the illusion of insight while hiding the signals that actually matter. The apps that grow sustainably are the ones that identify the right metrics, track them rigorously, and act on what the data reveals.
This guide covers the analytics framework we use at eawesome for our Australian clients’ apps. It is designed to be practical: what to measure, how to measure it, and how to turn data into decisions.
The Metrics That Matter
Acquisition Metrics
Downloads / Installs: The total number of people who install your app. This is a starting point, not a success metric. Downloads without engagement are worthless.
Install source: Where users come from (App Store search, paid ads, referral, social media). This tells you which acquisition channels are working and where to invest.
Cost Per Install (CPI): For paid acquisition, the cost to acquire one install. Australian CPI benchmarks vary by category, but expect AUD 2 to AUD 8 for most consumer apps.
Install-to-Registration Rate: What percentage of people who download actually create an account or complete onboarding? This is your first real conversion metric.
Engagement Metrics
Daily Active Users (DAU): The number of unique users who open your app each day. The definition of “active” should be meaningful. Opening the app and immediately closing it should not count. Define “active” as completing at least one core action.
Monthly Active Users (MAU): Same concept, monthly timeframe. Useful for apps that are not designed for daily use (e.g., travel apps, financial tools).
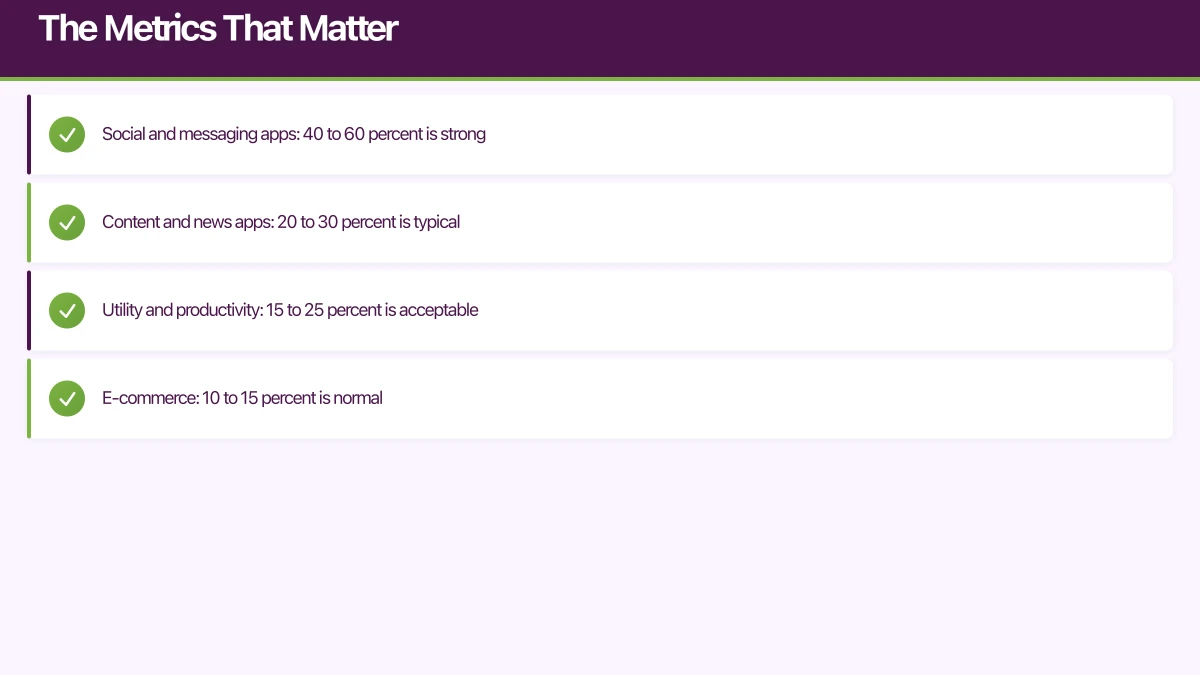
DAU/MAU Ratio (Stickiness): The percentage of monthly users who use the app on any given day. Higher is better.
- Social and messaging apps: 40 to 60 percent is strong
- Content and news apps: 20 to 30 percent is typical
- Utility and productivity: 15 to 25 percent is acceptable
- E-commerce: 10 to 15 percent is normal
Session Length: How long users spend in the app per session. Context matters. A banking app with short sessions might be well-designed (users accomplish their task quickly). A content app with short sessions might have an engagement problem.
Session Frequency: How often users open the app. Daily? Weekly? This should align with your app’s natural usage pattern.
Retention Metrics
Retention is the single most important category of metrics for mobile apps. If users do not come back, nothing else matters.
Day 1 Retention: Percentage of new users who return the day after first use. Benchmark: 25 to 40 percent for a good app.
Day 7 Retention: Percentage who return within a week. Benchmark: 15 to 25 percent.
Day 30 Retention: Percentage who return within a month. Benchmark: 8 to 15 percent.
These benchmarks vary by category. Gaming apps tend to have higher Day 1 but steeper dropoff. Utility apps may have lower Day 1 but more stable long-term retention.
Retention Curve: Plot retention over time. A healthy app shows a curve that flattens (users who survive the first week tend to stay). An unhealthy app shows continuous decline with no flattening.
Revenue Metrics
Average Revenue Per User (ARPU): Total revenue divided by total users. Includes non-paying users in the denominator.
Average Revenue Per Paying User (ARPPU): Revenue divided by paying users only. Useful for understanding your monetisation efficiency.
Lifetime Value (LTV): The total revenue you expect from a user over their entire relationship with your app. LTV must exceed your Customer Acquisition Cost (CAC) for a sustainable business.
LTV = ARPU x Average User Lifetime
Or more precisely: Sum of (Monthly ARPU x Retention Rate) for each month.
Setting Up Your Analytics Stac
k
Firebase Analytics (Recommended Starting Point)
Firebase Analytics (also known as Google Analytics for Firebase) is free, powerful, and integrates with other Firebase services. It is our default recommendation for new apps.
// iOS: Log a custom event
Analytics.logEvent("task_completed", parameters: [
    "task_category": "work" as NSObject,
    "completion_time_seconds": 45 as NSObject,
    "is_recurring": true as NSObject
])
// Android: Log a custom event
firebaseAnalytics.logEvent("task_completed") {
param("task_category", "work")
param("completion_time_seconds", 45)
param("is_recurring", true)
}// React Native
import analytics from '@react-native-firebase/analytics';
await analytics().logEvent('task_completed', {
task_category: 'work',
completion_time_seconds: 45,
is_recurring: true,
});Event Taxonomy
Design your event taxonomy before writing code. A well-structured taxonomy makes analysis easier and prevents the chaos of ad-hoc event naming.
Naming convention: Use snake_case, with a verb-noun pattern:
task_createdtask_completedproject_sharedsubscription_startedfilter_applied
Event categories:
- Lifecycle events:
app_opened,onboarding_completed,account_created,account_deleted - Core action events:
task_created,task_completed,project_created. These are the actions that define engagement. - Feature usage events:
filter_applied,search_performed,export_requested. These reveal which features users value. - Monetisation events:
purchase_initiated,purchase_completed,subscription_started,subscription_cancelled - Error events:
api_error,crash_occurred,payment_failed
Parameters: Attach relevant context to each event. For a task_created event, include the task category, whether it has a due date, and which screen the user created it from.
User Properties
Set user properties to segment your analytics:
Analytics.setUserProperty("premium", forName: "subscription_status")
Analytics.setUserProperty("power_user", forName: "user_segment")
Analytics.setUserProperty("au", forName: "country")
User properties enable you to compare metrics across segments. Are premium users more engaged than free users? Do users acquired from search behave differently from those acquired via social media?
Defining Your North S
tar Metric
Every app should have one primary metric that best represents the value users get from the product. This is your North Star Metric.
Examples:
- Task management app: Weekly active tasks completed
- Fitness app: Workouts completed per week
- Social app: Messages sent per active user per day
- Content app: Articles read per session
- E-commerce: Purchases per month
Your North Star Metric should be:
- Measurable: You can track it reliably
- Actionable: You can influence it through product changes
- Correlated with retention: Users who achieve high values of this metric stay longer
- Understandable: The entire team can explain what it means
Focus your product decisions on moving this metric. When evaluating a new feature, ask: “Will this increase our North Star Metric?”
Cohort Analysis
Cohort analysis is the most powerful tool in your analytics arsenal. It answers the question: “Are things getting better or worse over time?”
What Is Cohort Analysis?
A cohort is a group of users who share a common characteristic, typically their signup date. By comparing retention, engagement, or revenue across cohorts, you can see if product changes are improving outcomes.
Example cohort retention table:
| Cohort | Week 0 | Week 1 | Week 2 | Week 3 | Week 4 |
|---|---|---|---|---|---|
| Jan 1-7 | 100% | 30% | 22% | 18% | 16% |
| Jan 8-14 | 100% | 33% | 25% | 21% | 19% |
| Jan 15-21 | 100% | 35% | 28% | 24% | - |
| Jan 22-28 | 100% | 38% | 30% | - | - |
This table shows improving retention with each cohort, suggesting product improvements are working.
Behavioural Cohorts
Beyond time-based cohorts, group users by behaviour:
- Users who completed onboarding vs those who skipped it
- Users who used a specific feature vs those who did not
- Users who invited friends vs solo users
This reveals which behaviours predict long-term retention, which helps you design better onboarding and feature discovery.
Funnel Analysis
Map your key user journeys as funnels and measure conversion at each step:
Example: Onboarding Funnel
- App opened: 100%
- Welcome screen viewed: 95%
- Sign-up started: 60%
- Sign-up completed: 45%
- First task created: 30%
- Returned Day 2: 22%
The biggest drop-off is between “Welcome screen viewed” and “Sign-up started” (35 percent loss). This is where you should focus optimisation efforts.
Build funnel reports for every critical path in your app:
- Onboarding funnel
- Purchase funnel
- Feature adoption funnel
- Invitation/referral funnel
Acting on Your Data
Analytics without action is just overhead. Here is how to close the loop:
Weekly Metrics Review
Hold a 30-minute weekly review with your team:
- Review North Star Metric trend (15 minutes)
- Review experiment results (10 minutes)
- Decide next actions (5 minutes)
A/B Testing
Use your analytics insights to form hypotheses, then test them:
- Observation: Day 1 retention dropped for the latest cohort
- Hypothesis: The new onboarding flow is less effective
- Test: A/B test old vs new onboarding with equal traffic
- Measure: Compare Day 7 retention between groups
- Act: Ship the winner
Firebase A/B Testing integrates directly with Firebase Analytics, making this straightforward.
Segmented Analysis
When a metric changes, segment it to understand why:
- Did retention drop across all users, or just a specific cohort?
- Is engagement lower on iOS, Android, or both?
- Are users from a specific acquisition channel behaving differently?
Segmentation turns a confusing aggregate number into an actionable insight.
Common Analytics Mistakes
- Tracking everything but analysing nothing. Start with 20 to 30 well-chosen events, not 200.
- Celebrating downloads. Downloads are the beginning, not the goal.
- Ignoring retention. High DAU means nothing if users churn out as fast as they come in.
- Looking only at averages. Averages hide distribution. A small number of power users can skew ARPU significantly.
- Not segmenting. Aggregate metrics hide important differences between user groups.
- Changing event definitions. If you redefine what an event means, you break historical comparisons. Version your event schema.
- No baseline. You cannot tell if something improved without knowing where it started.
Privacy and Compliance
Australian privacy legislation and App Store policies require transparency about data collection.
- Disclose analytics collection in your privacy policy
- Respect Apple’s App Tracking Transparency framework on iOS
- Anonymise data where possible
- Provide opt-out mechanisms for non-essential tracking
- Comply with your App Store privacy nutrition labels
Firebase Analytics is designed to be privacy-compliant, but you are responsible for how you use the data it collects.
Getting Started
If you are launching a new app, start with this minimum analytics setup:
- Integrate Firebase Analytics
- Define your North Star Metric
- Implement 10 to 15 core events covering lifecycle, key actions, and monetisation
- Set up a retention report
- Create your primary conversion funnel
- Schedule a weekly metrics review
You can always add sophistication later. The most important thing is to start measuring from day one so you have baseline data for every decision you make.
At eawesome, analytics is built into our development process from the first sprint. The data our clients collect in their first weeks drives the product decisions that shape their app’s growth trajectory.
Your app’s marketing starts on the web. Cosmos Web Tech designs landing pages with SEO that help potential users find your app online.
Awesome Apps is the mobile development division of Ganda Tech Services, building iOS and Android apps for Australian businesses.
Talk to a Sydney app developer — free.
30 minutes. We'll tell you what your app needs, how long it takes, and what it costs. Real answers, no sales pitch.
Book Free App Strategy Call →Free · 30 minutes · No obligation