Introduction
You can’t improve what you don’t measure. Analytics transform guesswork into data-driven decisions—showing you exactly how users interact with your app, where they struggle, and what drives engagement.
But analytics implementations range from comprehensive insights to confusing noise. This guide covers how to implement analytics that actually inform product decisions.
Choosing an Analytics Platform
Majo
 r Options
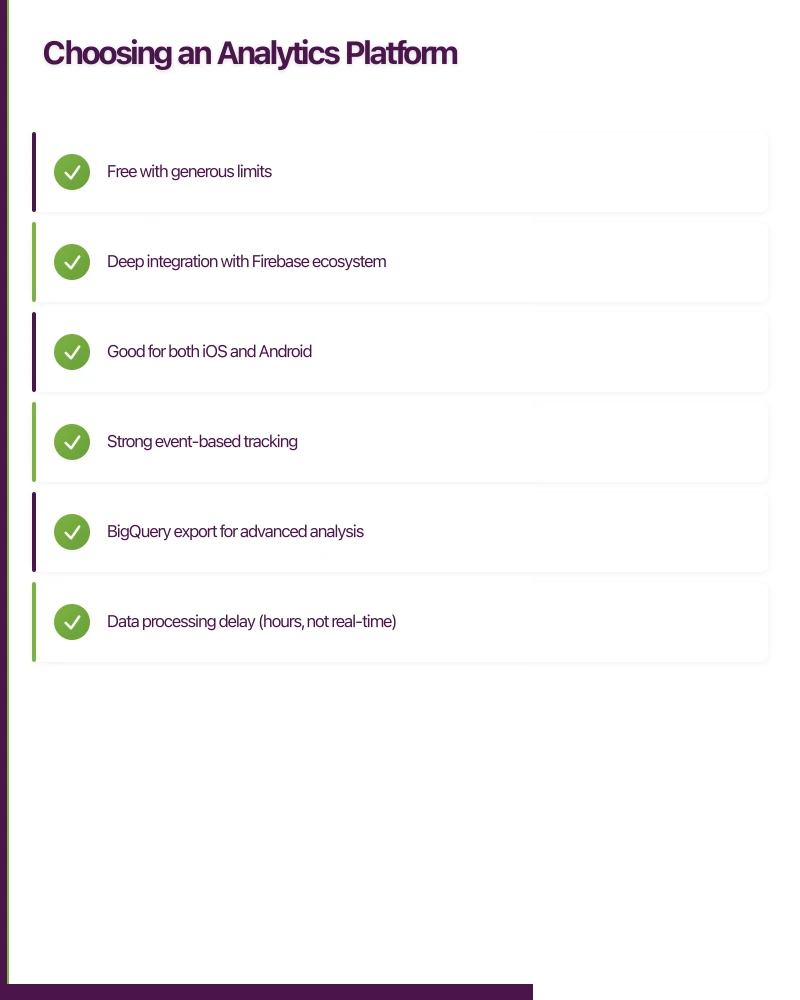
Firebase Analytics (Google Analytics for Firebase)
Best for: Most mobile apps, especially those using other Firebase services
Pros:
- Free with generous limits
- Deep integration with Firebase ecosystem
- Good for both iOS and Android
- Strong event-based tracking
- BigQuery export for advanced analysis
Cons:
- Data processing delay (hours, not real-time)
- Limited customization in free tier
- Google ecosystem dependency
Amplitude
Best for: Product-led growth companies, detailed user journey analysis
Pros:
- Excellent user journey and retention analysis
- Strong cohort analysis
- Real-time data
- Powerful behavioral analytics
Cons:
- Free tier limited (10M events/month)
- Enterprise pricing expensive
- Steeper learning curve
Mixpanel
Best for: Product teams focused on user behavior and funnels
Pros:
- Real-time analytics
- Strong funnel analysis
- Good segmentation
- Clean interface
Cons:
- Free tier limited
- Can get expensive at scale
- Some overlap with Amplitude
Segment
Not analytics itself, but routes data to other tools.
Best for: Companies using multiple analytics and marketing tools
Pros:
- Single SDK for multiple destinations
- Flexibility to change tools later
- Clean data infrastructure
Cons:
- Additional cost layer
- Adds complexity
- Still need analytics tools
Recommendation for Most Australian Apps
Start with Firebase Analytics:
- Free up to substantial scale
- Easy iOS and Android integration
- Sufficient for most product decisions
- Upgrade to paid tools when specific needs emerge
Planning Your Event Structure
The Event Taxonomy Problem
The biggest analytics mistake: ad-hoc event creation without structure.
Bad example:
clicked_button
button_press
tap_button
btn_click
button_clicked
All tracking button taps, but inconsistent naming makes analysis impossible.
Creating an Event Schema
Define a consistent structure before implementing:
Naming Convention: Use snake_case with clear hierarchy:
{object}_{action}or{category}_{action}_{object}
Examples:
product_viewedcart_item_addedcheckout_completedonboarding_step_completed
Event Properties (Parameters): Standardize property names:
item_id,item_name,item_categoryscreen_name,previous_screenvalue,currencytimestamp(usually automatic)
Essential Events for Most Apps
Acquisition Events:
app_install(automatic in Firebase)first_open(automatic in Firebase)registration_completedonboarding_completed
Engagement Events:
session_start(automatic)screen_view(configure properly)feature_usedwith feature name propertycontent_viewedwith content type/ID
Monetization Events:
purchase_initiatedpurchase_completedwith valuesubscription_startedsubscription_cancelled
Retention Events:
notification_receivednotification_openedshare_completedrating_submitted
Documenting Your Event Schema
Create a tracking plan document:
| Event Name | Description | Properties | Platform | Status |
|---|---|---|---|---|
| product_viewed | User views product detail | product_id, product_name, category, price | iOS, Android | Active |
| cart_item_added | Item added to cart | product_id, quantity, cart_value | iOS, Android | Active |
This document becomes essential for:
- Onboarding new developers
- Auditing implementation
- Planning analysis
- QA testing
Implementation
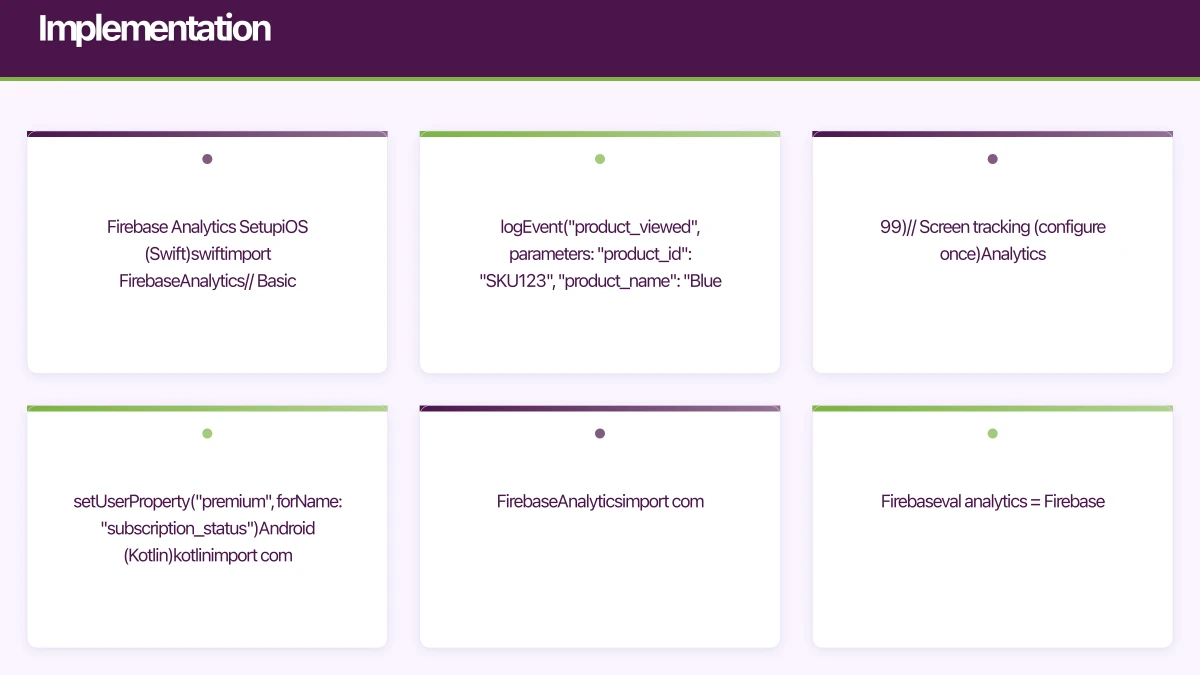
Firebase Analytics Setup
iOS (Swift)
import FirebaseAnalytics

// Basic event
Analytics.logEvent("product_viewed", parameters: [
    "product_id": "SKU123",
    "product_name": "Blue Widget",
    "category": "Widgets",
    "price": 29.99
])

// Screen tracking (configure once)
Analytics.logEvent(AnalyticsEventScreenView, parameters: [
    AnalyticsParameterScreenName: "ProductDetail",
    AnalyticsParameterScreenClass: "ProductDetailViewController"
])

// User properties
Analytics.setUserProperty("premium", forName: "subscription_status")
Android (Kotlin)
import com.google.firebase.analytics.FirebaseAnalytics
import com.google.firebase.analytics.ktx.analytics
import com.google.firebase.ktx.Firebase

val analytics = Firebase.analytics

// Basic event
val bundle = Bundle().apply {
    putString("product_id", "SKU123")
    putString("product_name", "Blue Widget")
    putString("category", "Widgets")
    putDouble("price", 29.99)
}
analytics.logEvent("product_viewed", bundle)

// Screen tracking
analytics.logEvent(FirebaseAnalytics.Event.SCREEN_VIEW) {
    param(FirebaseAnalytics.Param.SCREEN_NAME, "ProductDetail")
    param(FirebaseAnalytics.Param.SCREEN_CLASS, "ProductDetailActivity")
}

// User properties
analytics.setUserProperty("subscription_status", "premium")
React Native (with @react-native-firebase/analytics)
import analytics from '@react-native-firebase/analytics';

// Basic event
await analytics().logEvent('product_viewed', {
    product_id: 'SKU123',
    product_name: 'Blue Widget',
    category: 'Widgets',
    price: 29.99,
});

// Screen tracking
await analytics().logScreenView({
    screen_name: 'ProductDetail',
    screen_class: 'ProductDetailScreen',
});

// User properties
await analytics().setUserProperty('subscription_status', 'premium');
Amplitude Setup
iOS (Swift)
import Amplitude

// Initialize (in AppDelegate)
Amplitude.instance().initializeApiKey("YOUR_API_KEY")

// Track event
Amplitude.instance().logEvent("product_viewed", withEventProperties: [
    "product_id": "SKU123",
    "product_name": "Blue Widget",
    "category": "Widgets",
    "price": 29.99
])

// Identify user
let identify = AMPIdentify()
    .set("subscription_status", value: "premium" as NSObject)
Amplitude.instance().identify(identify)
Android (Kotlin)
import com.amplitude.api.Amplitude
import org.json.JSONObject

// Initialize
Amplitude.getInstance().initialize(context, "YOUR_API_KEY")
    .enableForegroundTracking(application)

// Track event
val eventProperties = JSONObject().apply {
    put("product_id", "SKU123")
    put("product_name", "Blue Widget")
    put("category", "Widgets")
    put("price", 29.99)
}
Amplitude.getInstance().logEvent("product_viewed", eventProperties)

// Identify user
val identify = Identify().set("subscription_status", "premium")
Amplitude.getInstance().identify(identify)
User Identification
Anonymous vs. Identified Users
Anonymous Users:
- Identified by device ID or randomly generated ID
- Can’t track across devices
- Lost if app reinstalled
- Still valuable for aggregate analysis
Identified Users:
- Associated with user account
- Trackable across devices
- Persistent identity
- Enables powerful cohort analysis
Implementing User Identification
When user logs in or creates account:
Firebase:
// Set user ID (use your internal ID, not email)
Analytics.setUserID("user_12345")

// Set user properties
Analytics.setUserProperty("account_type", forName: "premium")
Analytics.setUserProperty("signup_date", forName: "2024-04-25")
Amplitude:
Amplitude.instance().setUserId("user_12345")When user logs out:
// Clear user association
Analytics.setUserID(nil)
Amplitude.instance().setUserId(nil)
User Properties vs. Event Properties
User Properties: Attributes that describe the user, persist across events
- Subscription status
- Account age
- User segment
- Location (country/region)
Event Properties: Attributes that describe the specific event
- Product ID being viewed
- Button that was clicked
- Screen user came from
- Transaction value
Analyzing Key Metrics
Retention Analysis
Retention is often the most important metric. It answers: “Do users come back?”
Day 1 Retention: % of users who return 1 day after install Day 7 Retention: % who return after 7 days Day 30 Retention: % who return after 30 days
Benchmarks (vary by category):
- Day 1: 25-40% (good)
- Day 7: 10-20% (good)
- Day 30: 5-10% (good)
Low retention indicates:
- Poor onboarding
- Product-market fit issues
- Technical problems
- Wrong user acquisition
Funnel Analysis
Track user progression through key flows:
Onboarding Funnel:
- App opened -> 2. Tutorial started -> 3. Tutorial completed -> 4. Account created
Purchase Funnel:
- Product viewed -> 2. Add to cart -> 3. Checkout started -> 4. Purchase completed
Identify where users drop off—that’s where to focus improvement.
Cohort Analysis
Compare behavior across user groups:
Time-based Cohorts: Users who signed up in January vs. February Behavior-based Cohorts: Users who completed onboarding vs. skipped Acquisition-based Cohorts: Organic vs. paid users
Cohort analysis reveals whether changes improve user behavior.
Session Metrics
Session Duration: How long users spend per session Sessions per User: How often users open the app Screen Flow: What paths users take through the app
These indicate engagement depth and user journeys.
Privacy Compliance
Australian Privacy Act
The Privacy Act 1988 and Australian Privacy Principles (APPs) require:
- Clear privacy policy explaining data collection
- Consent for sensitive information
- Secure data handling
- User access to their data
Analytics data typically isn’t “sensitive information” under the Act, but transparency is required.
App Store Requirements
Apple App Tracking Transparency (ATT)
iOS 14.5+ requires explicit permission to track users across apps/websites.
import AppTrackingTransparency

ATTrackingManager.requestTrackingAuthorization { status in
    switch status {
    case .authorized:
        // Full tracking enabled
        Analytics.setAnalyticsCollectionEnabled(true)
    case .denied, .restricted:
        // Limit tracking
        Analytics.setAnalyticsCollectionEnabled(true) // Still allowed
        // But can't use IDFA for cross-app tracking
    case .notDetermined:
        break
    @unknown default:
        break
    }
}
Note: You can still collect first-party analytics without ATT consent. ATT applies to cross-app tracking.
Google Play Data Safety
Declare what data you collect in Play Console:
- Personal identifiers
- Device identifiers
- Usage data
- Diagnostics
Be accurate—Google verifies declarations.
Privacy-Respecting Implementation
Minimize Data Collection:
- Only collect what you’ll actually use
- Avoid collecting precise location unless needed
- Don’t collect unnecessary personal details
Provide User Controls:
- Allow users to opt out of analytics
- Respect system-level tracking settings
- Implement data deletion capability
Anonymous When Possible:
- Use anonymous IDs where sufficient
- Hash or truncate IP addresses
- Aggregate data for analysis
// Implement analytics opt-out
func setAnalyticsEnabled(_ enabled: Bool) {
    Analytics.setAnalyticsCollectionEnabled(enabled)
    UserDefaults.standard.set(enabled, forKey: "analyticsEnabled")
}
Common Implementation Mistakes
Tracking Everything
More events isn’t better. Track events that inform decisions:
- Does this event answer a product question?
- Will we act on this data?
- Is this sufficiently different from existing events?
Inconsistent Implementation
iOS and Android implementations drift:
- Use shared event schema document
- Review cross-platform consistency regularly
- Test both platforms during QA
Ignoring Context
Events without context are hard to interpret:
- Always include screen/source property
- Track relevant user state
- Include timestamps for time-based analysis
Not Testing Analytics
Analytics bugs are common:
- Include analytics in QA testing
- Verify events fire correctly
- Check property values are accurate
- Use debug mode during development
Firebase Debug:
// iOS - add to scheme arguments: -FIRAnalyticsDebugEnabled
// Events appear in DebugView within minutes
Analysis Paralysis
Having data isn’t the same as using it:
- Define key questions before diving into data
- Focus on actionable metrics
- Review regularly (weekly or sprint-based)
- Make decisions, not just reports
Building an Analytics Practice
Regular Review Cadence
Weekly: Key metrics dashboard review (retention, DAU, conversion) Sprint/Bi-weekly: Feature performance review Monthly: Deeper cohort and funnel analysis Quarterly: Comprehensive analytics health check
Questions Your Analytics Should Answer
- Are new users completing onboarding?
- What features do engaged users use most?
- Where do users drop off in key flows?
- Is retention improving or declining?
- How do different user segments behave?
- What drives purchases/upgrades?
From Insights to Action
Analytics only matter if they drive decisions:
- Observe: Data shows 60% drop-off at onboarding step 3
- Hypothesize: Step 3 requires too much effort
- Experiment: Simplify step 3, A/B test
- Measure: Compare completion rates
- Decide: Roll out winning variant
Repeat continuously.
Conclusion
Good analytics implementation requires:
- Clear event schema planned upfront
- Consistent implementation across platforms
- Privacy-respecting approach
- Regular analysis and action
- Iteration as needs evolve
Start simple, track what matters, and let data guide your product decisions. The best apps aren’t built on intuition alone—they’re refined through understanding real user behavior.
Need to set up CI/CD pipelines for your app builds? Cloud Geeks provides DevOps and cloud infrastructure services for development teams.
Ganda Tech Services brings together cloud infrastructure, web development, and mobile app expertise to help Australian businesses thrive in the digital economy.
Talk to a Sydney app developer — free.
30 minutes. We'll tell you what your app needs, how long it takes, and what it costs. Real answers, no sales pitch.
Book Free App Strategy Call →Free · 30 minutes · No obligation