Mobile App Development: Crash Analytics and Debugging Mastery
A crash in production mobile app development is inevitable. What separates good mobile development teams from great ones is how quickly they can identify, reproduce, and fix crashes before they tank app store ratings. After implementing crash analytics across dozens of production mobile app development projects, here’s everything you need to know about building a robust crash debugging workflow in mobile development for 2026.
The mobile crash landscape has evolved significantly. With iOS 18.4 and Android 15 both introducing new privacy-preserving crash reporting mechanisms, the tooling has had to adapt. Firebase Crashlytics 4.0, released in March 2026, now provides ML-powered crash clustering that actually works. Meanwhile, Sentry’s mobile SDK has matured into a serious contender with its session replay feature for mobile.
Choosing Your Crash Analytics Platform
The big three platforms for mobile crash analytics in 2026 are Firebase Crashlytics, Sentry, and Embrace. Each has distinct strengths depending on your app’s needs and your team’s workflow.
Firebase Crashlytics remains the default choice for most teams. It’s free, integrates seamlessly with the broader Firebase ecosystem, and the recent 4.0 update brought significant improvements. The ML-powered crash clustering now groups crashes by root cause rather than just stack trace similarity, reducing noise from variations in the same underlying issue.
// Firebase Crashlytics setup with custom keys (React Native)
import crashlytics from '@react-native-firebase/crashlytics';

// Set user context for debugging
async function setUserContext(user: User) {
  await crashlytics().setUserId(user.id);
  await crashlytics().setAttributes({
    subscription_tier: user.tier,
    app_version: APP_VERSION,
    device_storage_low: await checkStorageLow(),
  });
}

// Log non-fatal errors with context
function logError(error: Error, context: Record<string, string>) {
  crashlytics().log(`Error context: ${JSON.stringify(context)}`);
  crashlytics().recordError(error);
}
Sentry is the choice for teams that need cross-platform consistency. If you’re running a React Native or Flutter app alongside web properties, Sentry’s unified dashboard makes correlation straightforward. The mobile session replay feature, which reached general availability in early 2026, lets you watch a video-like reconstruction of user sessions leading to crashes.
Embrace is the premium option for teams with complex apps. It provides app-level performance monitoring alongside crash analytics, with particularly strong ANR (Application Not Responding) detection for Android. The price point is higher, but for apps where crashes directly impact revenue, the investment often pays off.
Setting Up Symbolication Properly
Symbolication is where most crash analytics setups fail. A crash report without proper symbolication is just a wall of memory addresses—useless for debugging. Getting this right requires attention during your CI/CD pipeline setup.
iOS Symbolication
iOS crash reports require dSYM files to convert memory addresses back to function names and line numbers. With Xcode 15.4, dSYM generation is enabled by default for Release builds, but you need to upload them to your crash analytics platform.
# In your Fastfile for iOS
lane :upload_symbols do
  # Download dSYMs from App Store Connect (for bitcode-enabled builds)
  download_dsyms(
    app_identifier: "com.yourapp.identifier",
    version: "latest"
  )

  # Upload to Crashlytics
  upload_symbols_to_crashlytics(
    gsp_path: "./GoogleService-Info.plist"
  )

  # Or upload to Sentry
  sentry_upload_dif(
    auth_token: ENV["SENTRY_AUTH_TOKEN"],
    org_slug: "your-org",
    project_slug: "your-project",
    path: "./build"
  )
end
Android Symbolication
Android requires mapping files for ProGuard/R8 obfuscated code and native symbol files for NDK crashes. The Firebase Gradle plugin handles most of this automatically, but native crashes require explicit configuration.
// build.gradle.kts
android {
    buildTypes {
        release {
            isMinifyEnabled = true
            ndk {
                debugSymbolLevel = "FULL" // Upload native symbols
            }
        }
    }
}

// For Crashlytics native symbolication
firebaseCrashlytics {
    nativeSymbolUploadEnabled = true
    mappingFileUploadEnabled = true
}
Building a Sy
 stematic Debugging Workflow
When a crash spike hits, you need a systematic approach. Panicking and diving into random crash reports wastes time. Here’s the workflow we use that consistently reduces time-to-fix.
Step 1: Triage by Impact
Not all crashes are equal. Prioritize based on a combination of frequency, user impact, and recency. Most crash analytics platforms provide an “impact” or “regret” score that factors in these dimensions.
// Custom crash prioritization logic
interface CrashPriority {
  frequency: number;      // Occurrences in last 24h
  userImpact: number;     // Unique users affected
  isNew: boolean;         // First seen after latest release
  affectedSegment: string; // Premium users vs. free
}

function calculatePriority(crash: CrashPriority): 'critical' | 'high' | 'medium' | 'low' {
  // New crashes in latest release are automatically high priority
  if (crash.isNew && crash.frequency > 10) return 'critical';

  // Crashes affecting premium users get elevated
  if (crash.affectedSegment === 'premium' && crash.userImpact > 5) {
    return 'high';
  }

  // Standard frequency-based prioritization
  if (crash.frequency > 100) return 'critical';
  if (crash.frequency > 50) return 'high';
  if (crash.frequency > 10) return 'medium';
  return 'low';
}
Step 2: Gather Context Before Diving In
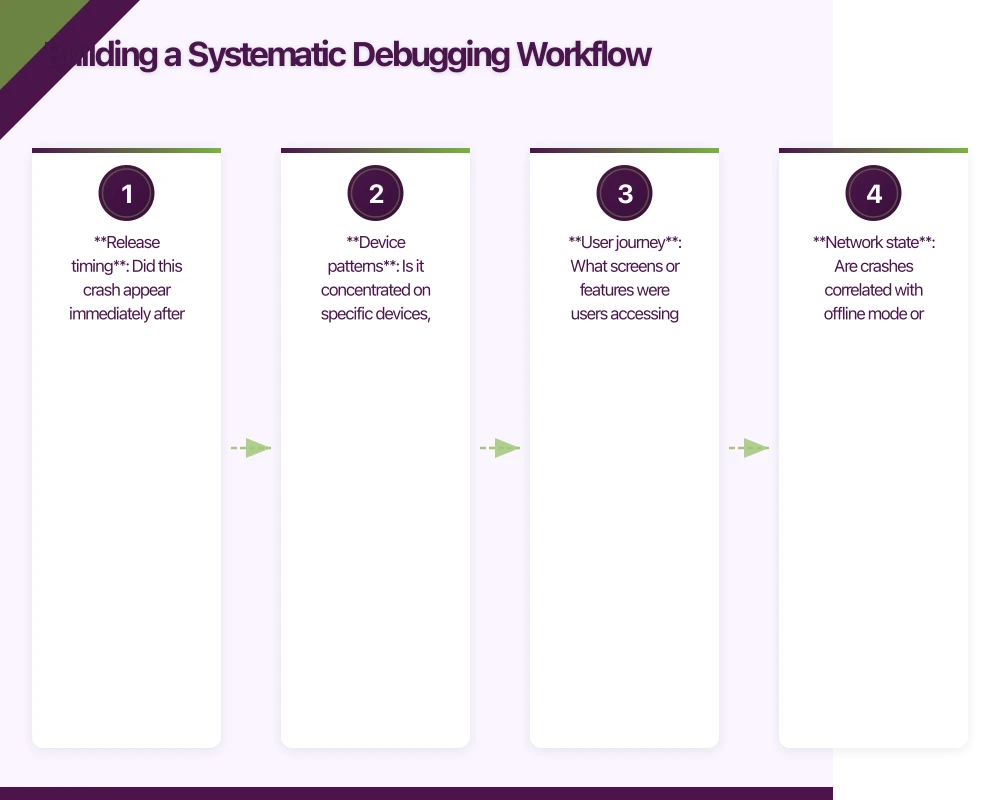
Before reading stack traces, gather context. What changed recently? What’s common among affected users? The answers often point you to the root cause faster than analyzing the crash itself.
Key questions to answer:
- Release timing: Did this crash appear immediately after a release, or is it growing gradually?
- Device patterns: Is it concentrated on specific devices, OS versions, or screen sizes?
- User journey: What screens or features were users accessing when crashes occurred?
- Network state: Are crashes correlated with offline mode or specific API responses?
Step 3: Reproduce Reliably
A crash you can reproduce is a crash you can fix. Use the context gathered to build a reproduction case. For crashes that only occur in production, create a debug build with additional logging around the suspected area.
// iOS: Conditional logging for production debugging
#if DEBUG
let logger = Logger(subsystem: "com.yourapp", category: "crash-investigation")
#else
let logger = ProductionLogger.shared // Sends to your analytics
#endif

func suspiciousFunction() {
    logger.debug("Entering suspiciousFunction with state: \(currentState)")

    defer {
        logger.debug("Exiting suspiciousFunction")
    }

    // Your code here
}
Common Crash Patterns an
 d Solutions
After analyzing thousands of crash reports, certain patterns appear repeatedly. Recognizing these saves significant debugging time.
Null Pointer Exceptions (Still the #1 Cause)
Despite Kotlin’s null safety and Swift’s optionals, null-related crashes remain the most common. They typically occur at API boundaries where type safety breaks down.
// Android: Defensive API response handling
data class ApiUser(
    val id: String,
    val name: String?,
    val email: String?
)

// Bad: Trusts API response
fun displayUser(user: ApiUser) {
    usernameText.text = user.name!! // Crash waiting to happen
}

// Good: Handles missing data gracefully
fun displayUser(user: ApiUser) {
    usernameText.text = user.name ?: "Unknown User"
    emailText.text = user.email ?: "No email provided"
    emailText.isVisible = user.email != null
}
Memory Pressure Crashes
iOS aggressively terminates apps under memory pressure. These often show as jetsam events rather than crashes, and won’t appear in standard crash reports. Monitor memory warnings and respond appropriately.
// iOS: Responding to memory pressure
class ImageCacheManager {
    private var cache = NSCache<NSString, UIImage>()

    init() {
        // Automatically clear cache on memory warning
        NotificationCenter.default.addObserver(
            self,
            selector: #selector(handleMemoryWarning),
            name: UIApplication.didReceiveMemoryWarningNotification,
            object: nil
        )

        // Set reasonable limits
        cache.countLimit = 100
        cache.totalCostLimit = 50 * 1024 * 1024 // 50MB
    }

    @objc private func handleMemoryWarning() {
        cache.removeAllObjects()
        Analytics.log("memory_warning_received", properties: [
            "cache_cleared": true
        ])
    }
}
Threading and Concurrency Issues
Race conditions and main thread violations are notoriously difficult to debug because they’re intermittent. Modern tooling helps catch these.
// iOS: Main thread assertion for UI updates
extension UIView {
    func safelyOnMainThread(_ closure: @escaping () -> Void) {
        if Thread.isMainThread {
            closure()
        } else {
            #if DEBUG
            assertionFailure("UI update attempted off main thread")
            #endif
            DispatchQueue.main.async(execute: closure)
        }
    }
}

// Usage
imageView.safelyOnMainThread {
    self.imageView.image = loadedImage
}
Advanced: Building Custom Crash Intelligence
Standard crash analytics tell you what crashed. Custom instrumentation tells you why. Building context-aware crash intelligence requires strategic breadcrumb logging.
// React Native: Comprehensive breadcrumb system
import crashlytics from '@react-native-firebase/crashlytics';

class BreadcrumbManager {
  private static maxBreadcrumbs = 50;
  private static breadcrumbs: string[] = [];

  static log(category: string, message: string, data?: object) {
    const timestamp = new Date().toISOString();
    const breadcrumb = `[${timestamp}] ${category}: ${message}`;

    this.breadcrumbs.push(breadcrumb);
    if (this.breadcrumbs.length > this.maxBreadcrumbs) {
      this.breadcrumbs.shift();
    }

    // Log to Crashlytics
    crashlytics().log(breadcrumb);

    // Store additional data as custom keys
    if (data) {
      crashlytics().setAttributes({
        [`last_${category}_data`]: JSON.stringify(data).slice(0, 100)
      });
    }
  }

  // Log navigation events
  static navigation(screen: string) {
    this.log('NAV', `Navigated to ${screen}`);
  }

  // Log user actions
  static action(action: string, target: string) {
    this.log('ACTION', `${action} on ${target}`);
  }

  // Log API calls
  static api(method: string, endpoint: string, status: number) {
    this.log('API', `${method} ${endpoint} -> ${status}`);
  }
}

// Usage throughout your app
BreadcrumbManager.navigation('ProfileScreen');
BreadcrumbManager.action('tap', 'edit_profile_button');
BreadcrumbManager.api('GET', '/api/v2/user/profile', 200);
Measuring Crash-Free Rate
Your crash-free session rate is the north star metric for app stability. Apple and Google both factor this into app store rankings, making it directly tied to discoverability.
Targets to aim for:
- 99.9%+ crash-free sessions: Excellent, competitive with top apps
- 99.5-99.9%: Good, room for improvement
- 99.0-99.5%: Needs attention, likely affecting user perception
- Below 99.0%: Critical, prioritize stability work immediately
Track this metric over time and set up alerts for regression. A 0.5% drop in crash-free rate after a release should trigger immediate investigation.
Conclusion
Effective crash analytics for mobile app development is about building systems, not just installing SDKs. The mobile development teams that excel at stability have invested in proper symbolication pipelines, systematic debugging workflows, and proactive crash prevention.
Start with proper symbolication in your mobile app development—nothing else matters if you can’t read your crash reports. Build a triage process that prioritizes by user impact. Implement breadcrumb logging that gives you context when crashes inevitably occur in mobile development. And track your crash-free rate as a key product metric.
The goal in mobile app development isn’t zero crashes—that’s impossible. The goal is finding and fixing crashes faster than users can leave bad reviews about them through systematic debugging and crash-analytics.
Enhance your stability with our guides on real-time features with WebSocket and feature flags and remote config.
Frequently Asked Questions About Mobile App Development Crash Analytics
What crash analytics platform should I use for mobile app development?
Firebase Crashlytics is the default choice for most mobile app development projects - it’s free, integrates with Firebase ecosystem, and offers ML-powered crash clustering. Use Sentry for advanced debugging needs with session replay, or Embrace for performance-focused mobile development with network monitoring.
How do I symbolicate crash reports in mobile development?
For iOS mobile app development, upload dSYMs automatically in Xcode build phases or via Fastlane. For Android mobile development, upload ProGuard/R8 mapping files during release builds. Without symbolication, crash reports show memory addresses instead of readable code - making debugging impossible.
What is a good crash-free rate for mobile app development?
Target 99%+ crash-free sessions for production mobile app development. Rates below 98% indicate serious stability issues. Monitor crash-free users (99.5%+) and sessions (99%+) separately. Apps with less than 97% crash-free rates typically see significant negative impact on app store ratings and mobile development success.
How can I reproduce crashes from production in mobile development?
Use crash-analytics breadcrumbs to understand user actions before crashes, implement detailed logging in crash-prone areas of your mobile app development, test on actual devices matching crash reports, and use feature flags to selectively enable problematic code paths for debugging mobile development issues.
Should I use multiple crash analytics tools for mobile app development?
Generally no - multiple crash SDKs increase app size, can interfere with each other’s symbolication in mobile app development, and add complexity. Choose one primary tool (Crashlytics or Sentry) for crash-analytics. Use APM (Application Performance Monitoring) tools separately for performance debugging in mobile development.
Key Crash Analytics Insights for Mobile App Development
Proper dSYM and ProGuard mapping file symbolication is non-negotiable - without it, crash reports are unreadable memory addresses instead of actionable stack traces for mobile app development teams.
Firebase Crashlytics 4.0’s ML-powered clustering reduces crash noise by 60-70% through grouping crashes by root cause rather than stack trace similarity - essential for efficient debugging in mobile development.
Apps maintaining 99%+ crash-free rates see 40% fewer negative app store reviews compared to apps at 95% crash-free - crash analytics and stability directly impact mobile app development success.
Need help implementing crash analytics in your mobile app? The Awesome Apps team has helped dozens of Australian startups build stable, production-ready apps through expert mobile app development. Get in touch to discuss your project.
App store listings drive installs, but a great website drives trust. Cosmos Web Tech creates conversion-optimised websites that complement your mobile app.
Awesome Apps operates under the Ganda Tech Services umbrella, delivering end-to-end technology solutions for Australian businesses.
Talk to a Sydney app developer — free.
30 minutes. We'll tell you what your app needs, how long it takes, and what it costs. Real answers, no sales pitch.
Book Free App Strategy Call →Free · 30 minutes · No obligation