Mobile App Memory Management and Leak Detection
Memory leaks are the silent killers of mobile apps. Unlike crashes that are immediately visible, memory leaks degrade performance gradually. Users experience slower navigation, jerky scrolling, and eventually an unexplained crash. By the time they notice, they have already formed a negative impression of your app.
Understanding how memory works on mobile and knowing how to detect and fix leaks is essential for every mobile developer. This guide covers the memory models of both iOS and Android, practical leak detection tools, and the patterns that prevent leaks from occurring.
How Mobile Memory Works
iOS Memory Model
iOS uses Automatic Reference Counting (ARC). Every object has a reference count. When the count reaches zero, the object is deallocated. This is deterministic: you know exactly when an object will be freed.
The problem arises with retain cycles: two objects hold strong references to each other, preventing either from being deallocated.
// Retain cycle example
class Parent {
    var child: Child?
}

class Child {
    var parent: Parent? // Strong reference back to parent
}

let parent = Parent()
let child = Child()
parent.child = child
child.parent = parent
// Neither can be deallocated when they go out of scope
Fix with weak references:
class Child {
    weak var parent: Parent? // Weak reference breaks the cycle
}
Android Memory Model
Android uses garbage collection (GC). The garbage collector periodically identifies objects that are no longer reachable from any GC root (activities, threads, static references) and reclaims their memory.
The problem arises when objects hold references to Android components (Activities, Fragments) beyond their lifecycle, preventing garbage collection.
// Memory leak: static reference to Activity
class LeakyClass {
    companion object {
        var activity: Activity? = null // Leaks the entire Activity
    }
}

// Memory leak: inner class holds implicit reference to outer class
class MyActivity : Activity() {
    private val handler = Handler(Looper.getMainLooper())

    fun startTimer() {
        // Anonymous Runnable holds implicit reference to MyActivity
        handler.postDelayed({
            updateUI()
        }, 10_000)
    }
    // If Activity is destroyed before the delay, it cannot be GC'd
}
Common Memory Leak Pattern
s
1. Closure/Callback Retain Cycles (iOS)
The most common iOS leak. Closures capture self strongly by default:
// Leak: closure captures self strongly
class ViewController: UIViewController {
    var timer: Timer?

    override func viewDidLoad() {
        super.viewDidLoad()
        timer = Timer.scheduledTimer(withTimeInterval: 1, repeats: true) { _ in
            self.updateLabel() // Strong capture of self
        }
    }
}

// Fix: use weak self
timer = Timer.scheduledTimer(withTimeInterval: 1, repeats: true) { [weak self] _ in
    self?.updateLabel()
}
2. Delegate Retain Cycles (iOS)
Delegates should always be weak:
// Leak: strong delegate
protocol DataManagerDelegate: AnyObject {
    func didLoadData()
}

class DataManager {
    var delegate: DataManagerDelegate? // Should be weak
}

// Fix:
class DataManager {
    weak var delegate: DataManagerDelegate?
}
3. NotificationCenter Observers (iOS)
Prior to iOS 9, failing to remove observers caused leaks. Even now, block-based observers require removal:
class ViewController: UIViewController {
    private var observer: NSObjectProtocol?

    override func viewDidLoad() {
        super.viewDidLoad()
        observer = NotificationCenter.default.addObserver(
            forName: .dataDidUpdate,
            object: nil,
            queue: .main
        ) { [weak self] notification in
            self?.handleUpdate(notification)
        }
    }

    deinit {
        if let observer = observer {
            NotificationCenter.default.removeObserver(observer)
        }
    }
}
4. Activity/Context Leaks (Android)
Passing an Activity context to long-lived objects is the most common Android leak:
// Leak: Activity context stored in singleton
class NetworkManager private constructor(val context: Context) {
    companion object {
        private var instance: NetworkManager? = null

        fun getInstance(context: Context): NetworkManager {
            return instance ?: NetworkManager(context).also { instance = it }
            // If context is an Activity, it is leaked forever
        }
    }
}

// Fix: use Application context
fun getInstance(context: Context): NetworkManager {
    return instance ?: NetworkManager(context.applicationContext).also {
        instance = it
    }
}
5. Handler Leaks (Android)
Non-static inner Handler classes hold an implicit reference to the enclosing Activity:
// Leak: inner class holds reference to Activity
class MyActivity : Activity() {
    private val handler = object : Handler(Looper.getMainLooper()) {
        override fun handleMessage(msg: Message) {
            // Implicit reference to MyActivity
            updateUI()
        }
    }
}

// Fix: static handler with weak reference
class MyActivity : Activity() {
    private val handler = SafeHandler(this)

    private class SafeHandler(activity: MyActivity) :
        Handler(Looper.getMainLooper()) {

        private val activityRef = WeakReference(activity)

        override fun handleMessage(msg: Message) {
            activityRef.get()?.updateUI()
        }
    }
}
6. Combine/RxSwift Subscription Leaks
Reactive frameworks create subscriptions that must be disposed:
// Leak: subscription not cancelled
class ViewController: UIViewController {
    override func viewDidLoad() {
        publisher
            .sink { [weak self] value in
                self?.handle(value)
            }
        // Subscription is never stored or cancelled
    }
}

// Fix: store and cancel subscriptions
class ViewController: UIViewController {
    private var cancellables = Set<AnyCancellable>()

    override func viewDidLoad() {
        publisher
            .sink { [weak self] value in
                self?.handle(value)
            }
            .store(in: &cancellables)
    }
    // Cancellables are automatically cancelled on dealloc
}
Detection Tool
 s
s
iOS: Instruments
Xcode Instruments is the definitive tool for iOS memory analysis.
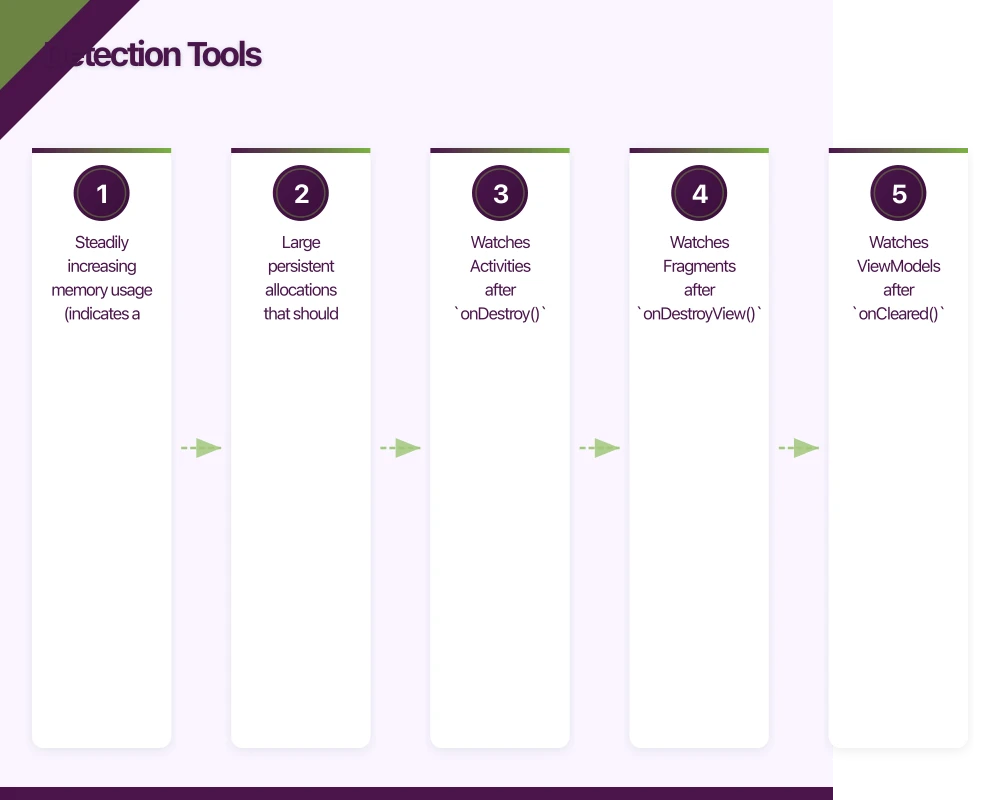
Allocations Instrument: Shows all memory allocations over time. Look for:
- Steadily increasing memory usage (indicates a leak)
- Large persistent allocations that should have been freed
Leaks Instrument: Automatically detects retain cycles and unreachable memory.
How to use:
- Product, then Profile (Cmd+I) in Xcode
- Select the Leaks template
- Run your app and exercise the leaking code path
- Leaks instrument highlights leaked objects with their retain history
Memory Graph Debugger: Available in Xcode’s debug navigator, this shows a visual graph of all objects and their references. It highlights retain cycles with purple warning indicators.
To use: Run your app in debug mode, then click the memory graph button in Xcode’s debug bar.
Android: LeakCanary
LeakCanary is the essential tool for Android memory leak detection. It runs automatically in debug builds and shows a notification when a leak is detected.
// build.gradle (app)
dependencies {
    debugImplementation 'com.squareup.leakcanary:leakcanary-android:2.9.1'
    // No release dependency needed - only runs in debug
}
That is the entire setup. LeakCanary automatically:
- Watches Activities after
onDestroy() - Watches Fragments after
onDestroyView() - Watches ViewModels after
onCleared() - Dumps the heap when a leak is detected
- Analyses the heap and identifies the leak trace
Android: Android Studio Profiler
The Android Studio Profiler provides real-time memory monitoring:
- Run your app in debug mode
- Open the Profiler tab (View, Tool Windows, Profiler)
- Select your process and click the Memory section
- Use “Dump Java Heap” to capture a snapshot
- Analyse retained objects and their reference chains
React Native: Flipper
For React Native apps, Flipper provides memory monitoring:
// Development only
if (__DEV__) {
  // Memory monitoring is available through Flipper
  // and the React Native performance monitor
}
Prevention Patterns
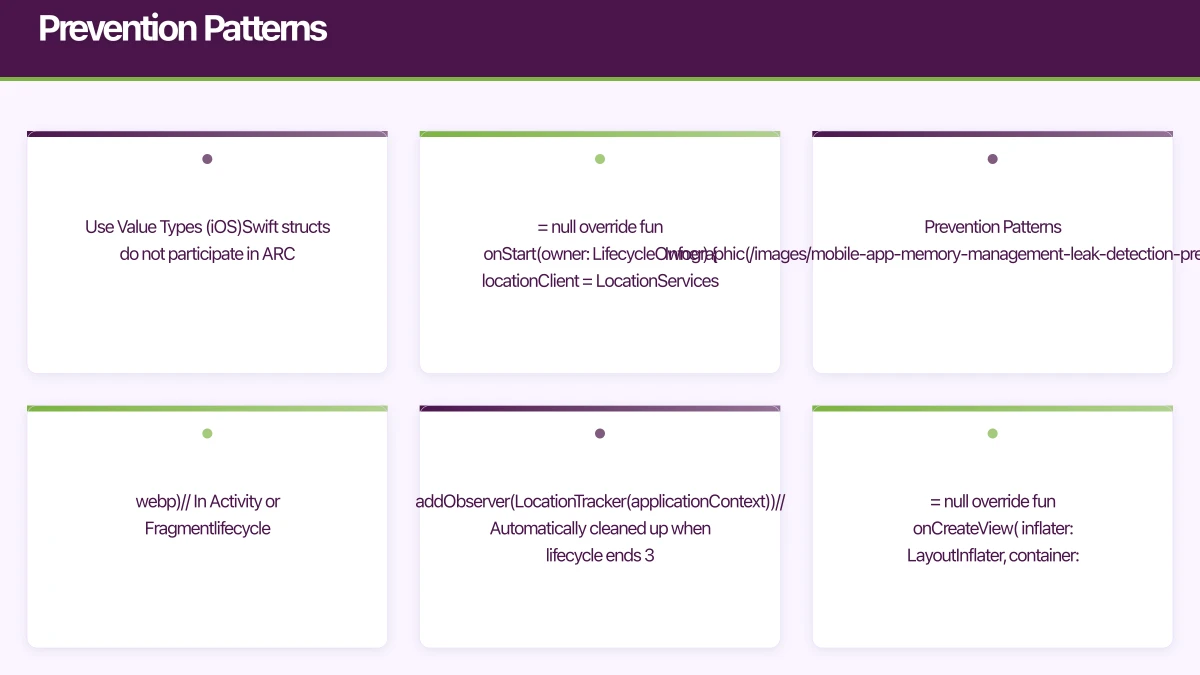
1. Use Value Types (iOS)
Swift structs do not participate in ARC. Where possible, prefer structs over classes:
// Struct: no reference counting, no retain cycles
struct UserProfile {
    let name: String
    let email: String
}

// Only use classes when you need reference semantics or inheritance
2. Lifecycle-Aware Components (Android)
Use lifecycle-aware components to automatically clean up resources:
class LocationTracker(
    private val context: Context
) : DefaultLifecycleObserver {

    private var locationClient: FusedLocationProviderClient? = null

    override fun onStart(owner: LifecycleOwner) {
        locationClient = LocationServices.getFusedLocationProviderClient(context)
        startTracking()
    }

    override fun onStop(owner: LifecycleOwner) {
        stopTracking()
        locationClient = null
    }
}

// In Activity or Fragment
lifecycle.addObserver(LocationTracker(applicationContext))
// Automatically cleaned up when lifecycle ends
3. Weak Reference Pattern
Use weak references for any back-reference or delegate:
// Protocol requires AnyObject for weak conformance
protocol DataDelegate: AnyObject {
    func didReceiveData(_ data: Data)
}

class DataManager {
    weak var delegate: DataDelegate?
}
4. Scoped Resources
Ensure resources are scoped to the appropriate lifecycle:
class MyFragment : Fragment() {
    // Scoped to Fragment lifecycle
    private var binding: FragmentMyBinding? = null

    override fun onCreateView(
        inflater: LayoutInflater,
        container: ViewGroup?,
        savedInstanceState: Bundle?
    ): View {
        binding = FragmentMyBinding.inflate(inflater, container, false)
        return binding!!.root
    }

    override fun onDestroyView() {
        super.onDestroyView()
        binding = null // Clean up binding reference
    }
}
Memory Budgets
Mobile devices have limited memory. Your app should operate within these guidelines:
- Under 50MB: Excellent. Suitable for simple apps.
- 50-100MB: Normal for medium-complexity apps.
- 100-200MB: Acceptable for content-rich apps with image caching.
- Over 200MB: You likely have a problem. Investigate.
iOS will terminate apps that use too much memory without warning. Android will kill background apps to reclaim memory. In both cases, high memory usage leads to poor user experience.
Automated Testing for Leaks
Add memory leak detection to your CI pipeline:
// iOS: XCTest memory leak detection
func testViewControllerDoesNotLeak() {
    var viewController: MyViewController? = MyViewController()
    weak var weakVC = viewController

    // Exercise the view controller
    viewController?.viewDidLoad()
    viewController?.performAction()

    // Release the strong reference
    viewController = nil

    // If weakVC is still non-nil, we have a leak
    XCTAssertNil(weakVC, "MyViewController should be deallocated")
}
Conclusion
Memory management is not glamorous work, but it directly impacts your app’s performance, stability, and user experience. Every mobile developer should understand their platform’s memory model, use the available detection tools regularly, and follow prevention patterns as standard practice.
Run Instruments and LeakCanary regularly, not just when users report problems. By the time a user notices a memory issue, the leak has likely been in your code for months.
For help diagnosing and fixing memory issues in your mobile app, contact eawesome. We optimise mobile app performance for Australian businesses.
Every great app needs reliable cloud infrastructure behind it. Cloud Geeks provides managed AWS and Azure hosting for mobile backends.
Ashish Ganda is the founder of Ganda Tech Services, a Sydney-based technology consultancy helping Australian businesses grow through cloud, web, and mobile solutions.
Talk to a Sydney app developer — free.
30 minutes. We'll tell you what your app needs, how long it takes, and what it costs. Real answers, no sales pitch.
Book Free App Strategy Call →Free · 30 minutes · No obligation