Introduction
Users don’t wait. Studies consistently show that app performance directly impacts user retention, ratings, and revenue. An app that feels sluggish loses users to competitors, no matter how good its features are.
Yet performance optimization often gets pushed aside for feature development. The result: apps that work but don’t delight. This guide covers practical approaches to measuring and improving mobile app performance.
Why Performance Matters
User Expectations
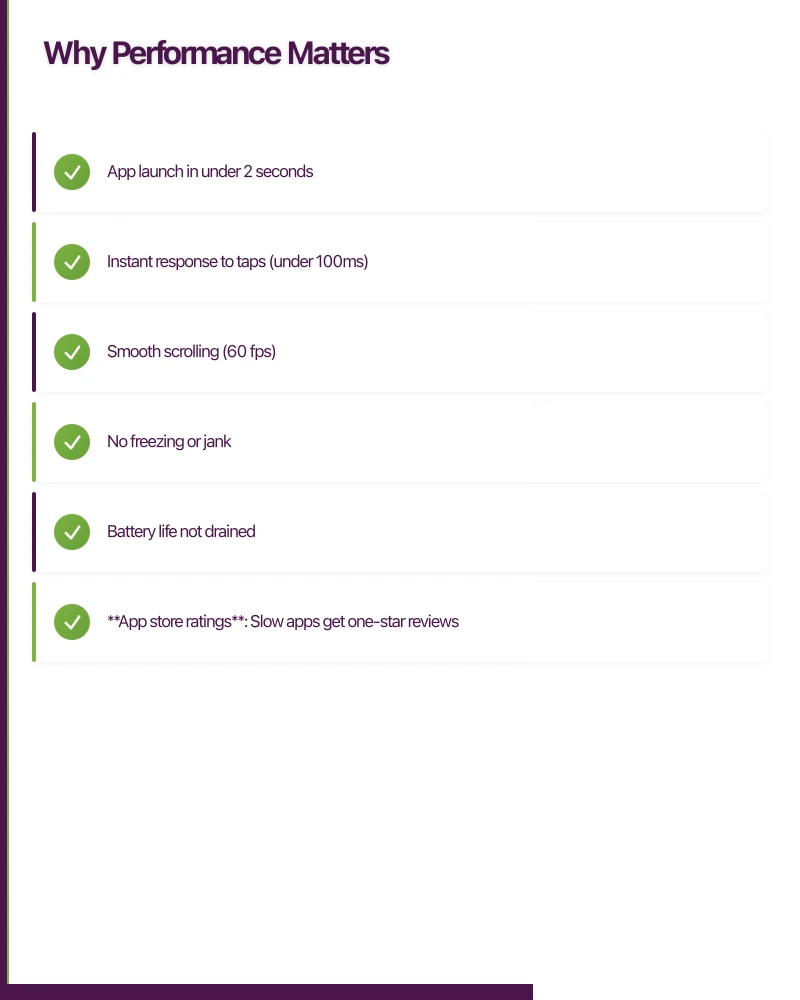
Mobile users expect:
- App launch in under 2 seconds
- Instant response to taps (under 100ms)
- Smooth scrolling (60 fps)
- No freezing or jank
- Battery life not drained
These expectations are set by the best apps on the platform. Users compare your app to those standards.
Business Impact
Performance affects measurable outcomes:
- App store ratings: Slow apps get one-star reviews
- User retention: Frustrated users don’t return
- Conversion rates: Sluggish checkout means abandoned purchases
- Session length: Poor performance shortens engagement
Technical Debt
Performance problems compound:
- Quick fixes become permanent
- Workarounds add complexity
- Testing becomes harder
- Refactoring becomes riskier
Addressing performance early prevents these accumulations.
Measuring Performanc
 e
e
Key Metrics
Startup Time
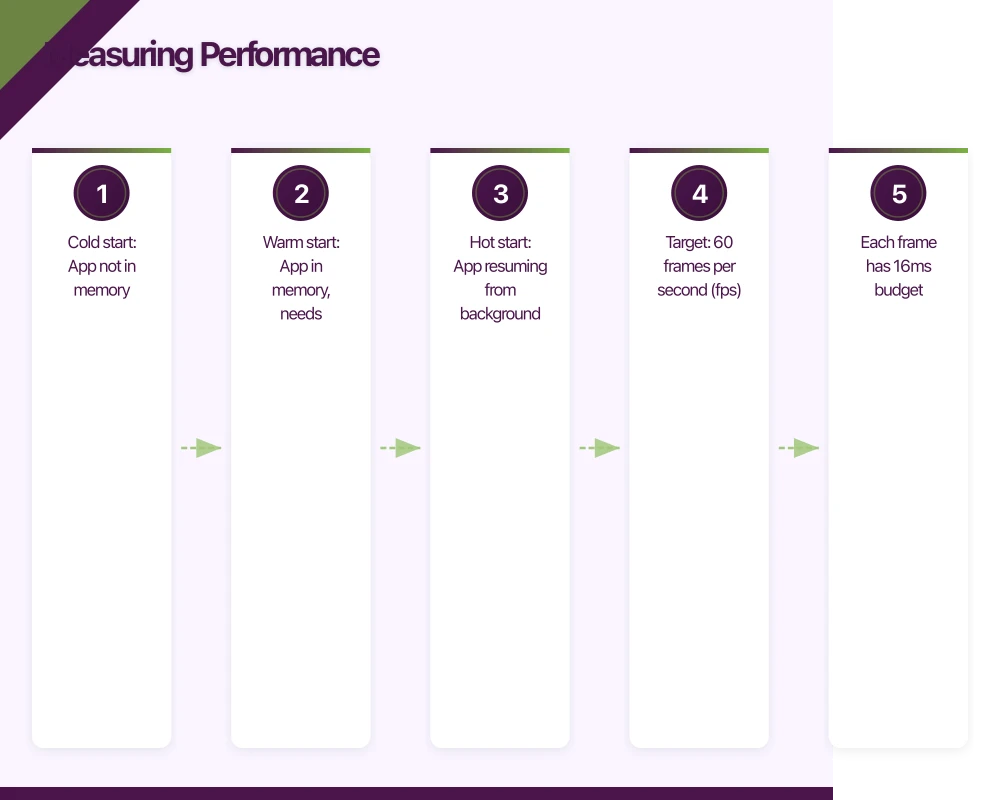
Time from tap to usable interface:
- Cold start: App not in memory
- Warm start: App in memory, needs rendering
- Hot start: App resuming from background
Target: Cold start under 2 seconds for most apps.
Frame Rate
Animations and scrolling smoothness:
- Target: 60 frames per second (fps)
- Each frame has 16ms budget
- Dropped frames cause visible stutter
Response Time
Time from user action to visual feedback:
- Under 100ms: Feels instant
- 100-300ms: Noticeable but acceptable
- Over 300ms: Feels slow
- Over 1 second: Needs loading indicator
Memory Usage
RAM consumption during operation:
- Affects app switching behaviour
- Impacts device stability
- Can cause crashes on low-memory devices
Battery Impact
Power consumption patterns:
- CPU usage
- Network activity
- GPS usage
- Background processing
Profiling Tools
iOS
- Instruments: Comprehensive profiling suite
- Xcode Debug Navigator: Real-time resource monitoring
- Core Animation Instrument: Frame rate analysis
- Time Profiler: CPU usage breakdown
Android
- Android Studio Profiler: CPU, memory, network, energy
- Systrace: System-wide performance data
- Layout Inspector: View hierarchy analysis
- Memory Profiler: Heap analysis and leak detection
Cross-Platform
- Flutter DevTools: Flutter-specific profiling
- React Native Hermes: JavaScript engine profiling
- Firebase Performance: Real-world performance data
Establishing Baselines
Before optimizing:
- Measure current performance on representative devices
- Document the metrics consistently
- Test on older/slower devices, not just flagships
- Capture both average and worst-case scenarios
- Set target metrics based on user expectations
You can’t improve what you don’t measure.
Common Performance Issues
Star
 tup Bottlenecks
Too Much Initialization
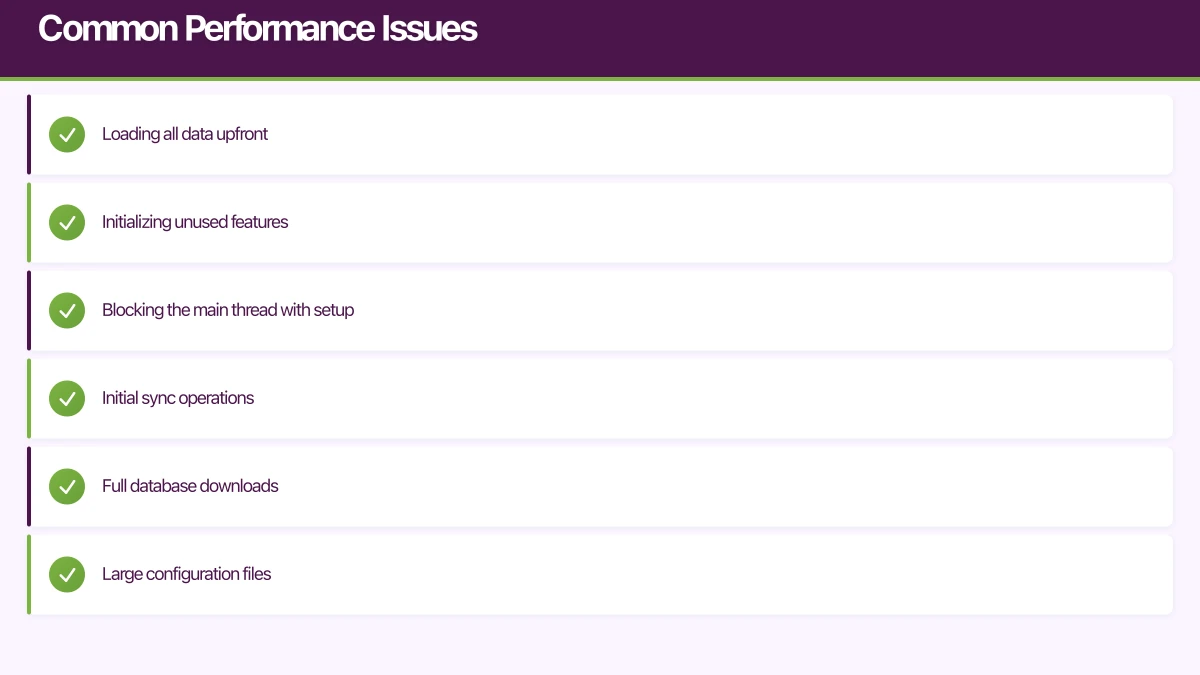
Apps often do too much at launch:
- Loading all data upfront
- Initializing unused features
- Blocking the main thread with setup
Fix: Defer non-critical initialization. Only set up what’s needed for the first screen.
Large Initial Payloads
Downloading megabytes before displaying anything:
- Initial sync operations
- Full database downloads
- Large configuration files
Fix: Load incrementally. Show content as it becomes available.
Cold Start Overhead
System-level delays:
- Process creation
- Runtime initialization
- Library loading
Fix: Minimize library dependencies. Use lazy loading where possible.
UI Rendering Issues
Complex View Hierarchies
Deep nesting of views causes:
- Slow layout calculations
- Increased memory usage
- Longer render times
Fix: Flatten hierarchies. Use efficient layouts.
Overdraw
Drawing the same pixels multiple times:
- Layered backgrounds
- Hidden views still rendering
- Transparent overlays
Fix: Eliminate unnecessary backgrounds. Remove hidden views from hierarchy.
Main Thread Blocking
Heavy work on the UI thread:
- Complex calculations
- Database operations
- Image processing
- File I/O
Fix: Move work to background threads. Only update UI on main thread.
Memory Problems
Memory Leaks
Objects not properly released:
- Strong reference cycles
- Forgotten listeners
- Static references
- Callback retention
Fix: Use proper memory management patterns. Profile regularly.
Large Allocations
Creating too many large objects:
- Unoptimized images
- Excessive caching
- Data duplication
Fix: Resize images appropriately. Limit cache sizes.
Memory Churn
Rapid allocation and deallocation:
- Creating objects in loops
- Unnecessary temporary objects
- Poor object reuse
Fix: Reuse objects where possible. Use object pools.
Network Issues
Unoptimized Requests
Inefficient API usage:
- Too many small requests
- Missing compression
- No caching
- Redundant data fetching
Fix: Batch requests. Enable compression. Cache responses.
Large Payloads
Transferring more data than needed:
- Full objects when partial would work
- Images at original resolution
- Uncompressed data
Fix: Request only needed fields. Serve appropriate image sizes.
Missing Offline Handling
Network operations blocking the UI:
- Waiting for responses
- No local data fallback
- Poor timeout handling
Fix: Implement offline-first architecture. Cache aggressively.
Optimization Strategies
Lazy Loading
Load resources when needed, not before:
// Instead of loading everything at startup
class DataManager {
    // Only created when first accessed
    lazy var database: Database = {
        return Database.open()
    }()

    lazy var heavyProcessor: Processor = {
        return Processor.initialize()
    }()
}
Apply to:
- Heavy feature modules
- Large data sets
- Infrequently used functionality
Image Optimization
Images often dominate app size and memory:
Loading
- Use appropriate resolution for display size
- Implement progressive loading
- Consider lazy loading for off-screen images
Caching
- Cache decoded images, not just raw data
- Limit cache size based on device memory
- Clear cache under memory pressure
Formats
- Use efficient formats (WebP, HEIF where supported)
- Compress appropriately for use case
- Consider vector graphics for scalable elements
Efficient Lists
Scrolling lists require special attention:
Recycling
Reuse cells/views instead of creating new ones:
- iOS: UICollectionView with cell reuse
- Android: RecyclerView with ViewHolder
- Flutter: ListView.builder
Pre-computation
Calculate heights and layouts ahead of time:
- Fixed heights when possible
- Cached calculated heights
- Estimated heights for initial scroll
Pagination
Don’t load everything at once:
- Load initial batch
- Fetch more as user scrolls
- Consider placeholder loading
Background Processing
Keep the main thread free:
Threading
- Use dedicated background queues/threads
- Avoid blocking the main thread
- Return to main thread only for UI updates
Batching
- Combine multiple operations
- Process in chunks, not all at once
- Yield to allow other work
Prioritization
- Visible content first
- Off-screen content lower priority
- User-initiated tasks highest priority
Caching Strategies
Reduce redundant work and network calls:
Memory Cache
- Fast access, limited capacity
- Eviction policy (LRU typically)
- Cleared on memory pressure
Disk Cache
- Larger capacity, slower access
- Survives app restart
- Manual size management
Network Cache
- HTTP caching headers
- Conditional requests (ETags)
- CDN utilization
Platform-Specific Considerations
iOS Optimization
Auto Layout
- Constraint solving can be expensive
- Prefer simpler constraint sets
- Consider manual layout for performance-critical views
Core Animation
- Use layer-backed views when appropriate
- Enable rasterization for static content
- Be careful with shadows and masks
Grand Central Dispatch
- Use appropriate QoS levels
- Avoid overloading with too many concurrent tasks
- Main queue for UI only
Android Optimization
Layout Performance
- ConstraintLayout for flat hierarchies
- Avoid RelativeLayout nesting
- Use merge tags in includes
RecyclerView
- Stable IDs for consistent item tracking
- Prefetch distance tuning
- Shared element pools
Kotlin Coroutines
- Proper dispatcher selection
- Structured concurrency
- Avoid blocking calls
Cross-Platform Considerations
React Native
- Minimize bridge crossings
- Use native components for performance
- Enable Hermes engine for improved startup
Flutter
- Use const widgets where possible
- Implement shouldRepaint carefully
- Profile with Flutter DevTools
Testing Performance
Device Selection
Test on representative devices:
- Not just your high-end development device
- Include older devices users still have
- Test across screen sizes
- Include both iOS and Android
Automation
Automate performance testing:
- Startup time measurement
- Frame rate monitoring
- Memory tracking
- Regression detection in CI
Real-World Conditions
Test under realistic conditions:
- Poor network connectivity
- Low memory situations
- Background app pressure
- Battery saver mode
Monitoring in Production
Track performance after release:
- Firebase Performance Monitoring
- Custom metrics through analytics
- Crash rate correlation
- User-reported issues
Building a Performance Culture
From the Start
Consider performance early:
- Performance requirements in specifications
- Profiling as part of development
- Performance gates in review process
Regular Reviews
Schedule performance reviews:
- Monthly profiling sessions
- Pre-release performance verification
- Post-release monitoring review
Team Awareness
Build performance knowledge:
- Share optimization learnings
- Document performance patterns
- Create reusable optimized components
Conclusion
Performance optimization isn’t a one-time task—it’s an ongoing discipline. The best apps maintain performance through continuous attention: measuring regularly, addressing issues promptly, and preventing regressions systematically.
Start with measurement. Understand where your app currently stands. Identify the biggest bottlenecks. Fix them. Measure again.
Users may not notice when an app is fast—but they definitely notice when it’s slow. Good performance is invisible; poor performance drives users away.
For executive-level thinking on mobile strategy and digital transformation, explore Ash Ganda’s blog.
Ganda Tech Services brings together cloud infrastructure, web development, and mobile app expertise to help Australian businesses thrive in the digital economy.
Talk to a Sydney app developer — free.
30 minutes. We'll tell you what your app needs, how long it takes, and what it costs. Real answers, no sales pitch.
Book Free App Strategy Call →Free · 30 minutes · No obligation