Mobile App Development: Startup Time Optimization Guide
App startup time is the first impression your app makes in mobile app development. Research from Google shows that 53% of mobile users abandon apps that take more than 3 seconds to load. Apple and Google both prioritize app launch performance in their store rankings and review guidelines. Yet many development teams treat startup optimization as an afterthought, only investigating when user reviews start complaining.
This guide provides actionable mobile app development techniques to measure and reduce startup time on both iOS and Android. These are not theoretical suggestions—they are strategies proven across production apps serving hundreds of thousands of users. For comprehensive performance optimization, see our mobile app performance guide.
Understanding Startup Types
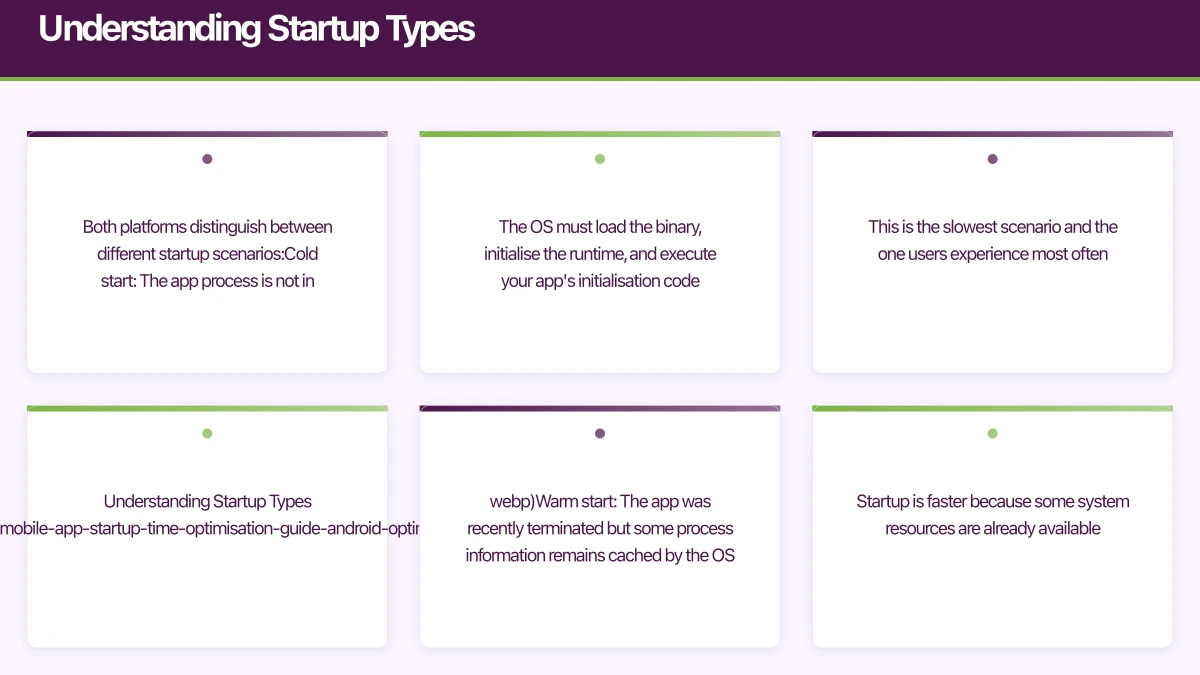
Both platforms distinguish between different startup scenarios:
Cold start: The app process is not in memory. The OS must load the binary, initialise the runtime, and execute your app’s initialisation code. This is the slowest scenario and the one users experience most often.
Warm start: The app was recently terminated but some process information remains cached by the OS. Startup is faster because some system resources are already available.
Hot start (resume): The app is in the background and simply needs to be brought to the foreground. This is nearly instantaneous.
Cold start is what we optimise for. It is the worst case and the scenario users encounter after restarting their phone, clearing recent apps, or opening your app for the first time in hours.
Measuring Startup
Time
You cannot optimise what you do not measure accurately.
iOS Measurement
Xcode provides the DYLD_PRINT_STATISTICS environment variable that logs detailed startup timing:
Total pre-main time: 312.47 milliseconds (100.0%)
  dylib loading time: 165.34 milliseconds (52.9%)
  rebase/binding time:  25.67 milliseconds (8.2%)
  ObjC setup time:      42.13 milliseconds (13.4%)
  initializer time:     79.33 milliseconds (25.3%)
For post-main measurement, add instrumentation to your AppDelegate:
class AppDelegate: UIResponder, UIApplicationDelegate {
    static let launchStart = CFAbsoluteTimeGetCurrent()

    func application(
        _ application: UIApplication,
        didFinishLaunchingWithOptions launchOptions: [UIApplication.LaunchOptionsKey: Any]?
    ) -> Bool {
        let launchTime = CFAbsoluteTimeGetCurrent() - AppDelegate.launchStart
        print("App launch time: \(launchTime * 1000)ms")

        // Report to analytics
        Analytics.logEvent("app_cold_start", parameters: [
            "duration_ms": Int(launchTime * 1000)
        ])

        return true
    }
}
Use Xcode Instruments with the App Launch template for detailed profiling. It shows exactly where time is spent during startup.
Android Measurement
Android logs cold start time automatically:
I/ActivityManager: Displayed com.yourapp/.MainActivity: +1s234msFor programmatic measurement:
class MyApplication : Application() {
    override fun onCreate() {
        super.onCreate()

        val processStart = Process.getStartElapsedRealtime()
        val appCreateTime = SystemClock.elapsedRealtime()

        // Report pre-Application.onCreate time
        val preCreateMs = appCreateTime - processStart
        Log.d("Startup", "Pre-onCreate: ${preCreateMs}ms")
    }
}

class MainActivity : AppCompatActivity() {
    override fun onCreate(savedInstanceState: Bundle?) {
        super.onCreate(savedInstanceState)

        // Report first frame rendered
        window.decorView.post {
            val totalStartup = SystemClock.elapsedRealtime() -
                Process.getStartElapsedRealtime()
            Log.d("Startup", "Total cold start: ${totalStartup}ms")

            // Report to analytics
            FirebaseAnalytics.getInstance(this)
                .logEvent("cold_start") {
                    param("duration_ms", totalStartup)
                }
        }
    }
}
Android Studio’s CPU Profiler with the “Startup” configuration provides detailed flame charts of your startup sequence.
iOS Optimisation Techn
iques
Reduce Dynamic Library Loading
Every dynamic framework your app loads at startup adds to pre-main time. The impact is significant: each framework can add 5-20ms.
Audit your frameworks. Run otool -L YourApp.app/YourApp to list all linked dynamic libraries. Question every one — do you need it at startup, or can it be loaded lazily?
Prefer static linking. Where possible, link libraries statically rather than dynamically. In CocoaPods:
# Podfile
use_frameworks! :linkage => :static
Merge frameworks. If you have multiple small frameworks, consider merging them into fewer larger ones. The overhead is per-framework, not per-code-size.
Defer Initialisation
Move work out of application(_:didFinishLaunchingWithOptions:) into background queues or later in the app lifecycle:
func application(
    _ application: UIApplication,
    didFinishLaunchingWithOptions launchOptions: [UIApplication.LaunchOptionsKey: Any]?
) -> Bool {
    // MUST happen at launch
    configureAppearance()
    setupCoreData()

    // Defer to background
    DispatchQueue.global(qos: .utility).async {
        self.initializeAnalytics()
        self.preloadCache()
        self.configureRemoteConfig()
    }

    // Defer until after first frame
    DispatchQueue.main.async {
        self.registerForNotifications()
        self.checkForUpdates()
        self.setupDeepLinking()
    }

    return true
}
Binary Optimisation
Enable Link Time Optimization (LTO) in your Xcode build settings. This allows the compiler to optimise across translation units, reducing binary size and improving startup:
LLVM_LTO = YES // or Monolithic for maximum optimizationOrder files tell the linker to arrange functions in the order they are called during startup, improving page fault performance. Profile your app’s startup to generate an order file, then configure it in Build Settings under “Order File.”
Launch Storyboard Optimisation
Your launch storyboard (or launch screen) is shown while the app initialises. Make it lightweight — avoid custom images, complex layouts, or Auto Layout constraints that require computation. A solid colour background with your app icon is ideal.
Android Optimisation
 Techniques
Application Class Optimisation
The Application.onCreate() method runs before any Activity is created. Keep it minimal:
class MyApplication : Application() {
    override fun onCreate() {
        super.onCreate()

        // Essential only - everything else deferred
        if (BuildConfig.DEBUG) {
            StrictMode.setThreadPolicy(
                StrictMode.ThreadPolicy.Builder()
                    .detectAll()
                    .penaltyLog()
                    .build()
            )
        }
    }
}
Move SDK initialisation to background threads or use the App Startup library:
// Using Jetpack App Startup for ordered, lazy initialization
class AnalyticsInitializer : Initializer<AnalyticsService> {
    override fun create(context: Context): AnalyticsService {
        return AnalyticsService.init(context)
    }

    override fun dependencies(): List<Class<out Initializer<*>>> {
        return emptyList()
    }
}

class CrashReportingInitializer : Initializer<CrashReporter> {
    override fun create(context: Context): CrashReporter {
        return CrashReporter.init(context)
    }

    override fun dependencies(): List<Class<out Initializer<*>>> {
        return listOf(AnalyticsInitializer::class.java)
    }
}
Splash Screen API
Android 12 introduced the SplashScreen API. Use it to provide a smooth transition while deferring heavy initialisation:
class MainActivity : AppCompatActivity() {
override fun onCreate(savedInstanceState: Bundle?) {
val splashScreen = installSplashScreen()
// Keep splash screen visible while loading essential data
var isReady = false
splashScreen.setKeepOnScreenCondition { !isReady }
super.onCreate(savedInstanceState)
setContentView(R.layout.activity_main)
lifecycleScope.launch {
// Load essential data
val userData = repository.loadUser()
val config = repository.loadConfig()
isReady = true
}
}
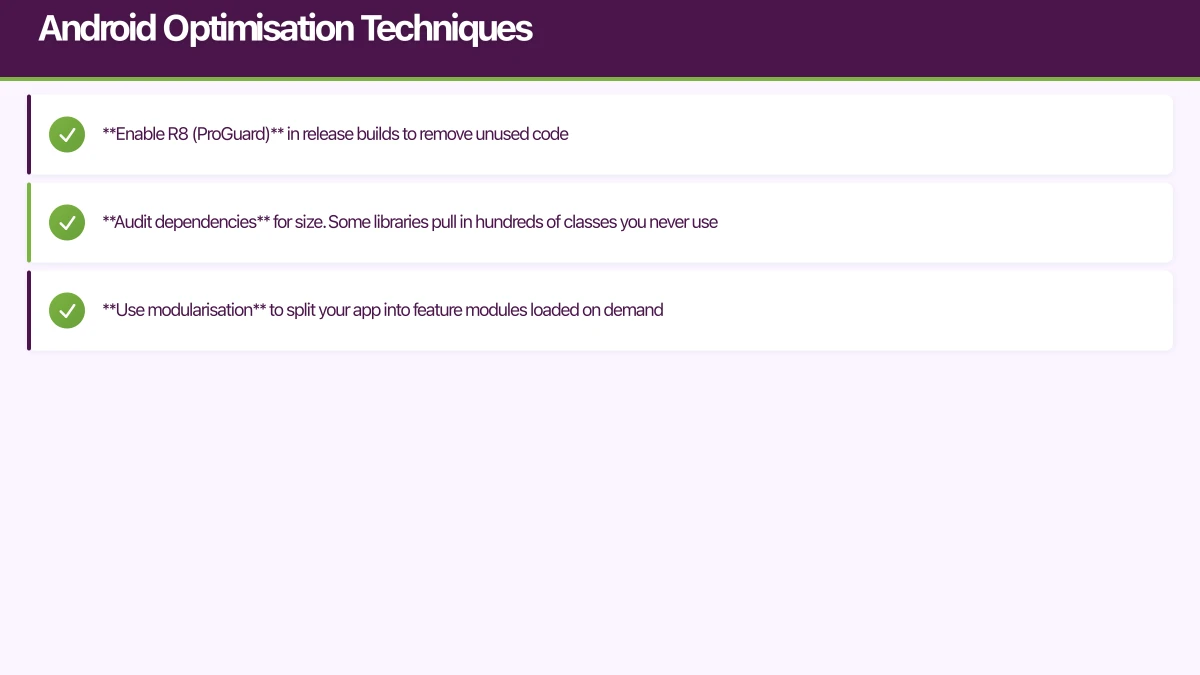
}Reduce DEX Size and Method Count
Every class and method in your DEX files adds to startup time because the runtime must load and verify them:
- Enable R8 (ProGuard) in release builds to remove unused code
- Audit dependencies for size. Some libraries pull in hundreds of classes you never use
- Use modularisation to split your app into feature modules loaded on demand
// build.gradle
android {
    buildTypes {
        release {
            minifyEnabled true
            shrinkResources true
            proguardFiles getDefaultProguardFile('proguard-android-optimize.txt'),
                'proguard-rules.pro'
        }
    }
}
Baseline Profiles
Baseline Profiles are one of the most impactful Android optimisations. They tell the ART runtime which code paths to pre-compile, dramatically reducing JIT compilation during startup:
// benchmark/src/.../BaselineProfileGenerator.kt
@RunWith(AndroidJUnit4::class)
class BaselineProfileGenerator {
    @get:Rule
    val rule = BaselineProfileRule()

    @Test
    fun generateBaselineProfile() {
        rule.collectBaselineProfile(
            packageName = "com.au.yourcompany.app"
        ) {
            // Simulate typical startup actions
            startActivityAndWait()

            // Navigate through critical user flows
            device.findObject(By.text("Browse")).click()
            device.waitForIdle()

            device.findObject(By.text("Search")).click()
            device.waitForIdle()
        }
    }
}
Google reports that Baseline Profiles can improve startup time by 20-40% for medium to large apps.
Cross-Platform Techniques
Lazy Loading
Load features and data only when needed, not at startup:
// Instead of loading all data at startup
class HomeViewModel: ObservableObject {
    @Published var products: [Product] = []

    // Load when the view appears, not at app startup
    func onAppear() {
        Task {
            products = try await productService.fetchFeatured()
        }
    }
}
Network Request Prioritisation
If your app makes network requests at startup, prioritise the one that unlocks the UI:
// Load essential config first, defer everything else
suspend fun startup() = coroutineScope {
    // Critical path - blocks UI
    val config = async { configService.fetchAppConfig() }

    // Parallel but non-blocking
    launch { analyticsService.syncEvents() }
    launch { featureFlagService.refresh() }

    // Wait only for the critical path
    applyConfig(config.await())
}
Image and Asset Optimisation
Heavy assets loaded at startup are a common bottleneck:
- Use compressed formats (WebP for Android, HEIC for iOS)
- Size assets appropriately for each screen density
- Load images asynchronously with placeholder views
- Cache aggressively to avoid re-downloading on subsequent launches
Target Benchmarks
Aim for these cold start times:
| Platform | Good | Acceptable | Needs Work |
|---|---|---|---|
| iOS | Under 400ms | Under 1s | Over 2s |
| Android | Under 500ms | Under 1.5s | Over 3s |
These targets represent the time from the user tapping your icon to seeing interactive content in mobile app development. Monitor them in production through analytics, and set up alerts when they degrade.
Key insight for mobile app development: Apps with under 1-second cold start times see 35-40% higher Day-1 retention compared to apps exceeding 3 seconds, making startup optimization critical for user retention.
The best time to optimize startup performance in mobile app development is before it becomes a problem. Measure it from day one, set budgets, and treat regressions as seriously as bugs.
Mobile app development best practice: Lazy loading non-critical resources reduces startup time by 40-60% and decreases initial app memory footprint by 30-50%.
Frequently Asked Questions
What is a good startup time for mobile apps?
Good mobile app development cold start times: iOS under 400ms, Android under 500ms from icon tap to interactive content. Acceptable: iOS under 1s, Android under 1.5s. Anything over 2s (iOS) or 3s (Android) needs immediate optimization. Warm starts should be under 200ms. Monitor startup time in production analytics and set alerts for regressions.
How do you measure app startup time?
Measure app startup time in mobile app development using platform tools: Xcode Instruments (Time Profiler, App Launch) for iOS, Android Studio Profiler and Jetpack Macrobenchmark for Android. Instrument code with custom timing: record app launch start, measure time to first interactive frame, track critical path operations. Use Firebase Performance Monitoring or similar for production metrics across all devices and OS versions.
What causes slow app startup in mobile app development?
Common causes of slow startup in mobile app development: heavy initialization (database, SDKs, analytics), synchronous network calls on main thread, large asset loading (images, fonts), complex view hierarchies, excessive dependencies loaded at launch, and unnecessary work before first render. Profile your app to identify bottlenecks—optimization without measurement wastes time.
How do you implement lazy loading for mobile apps?
Implement lazy loading in mobile app development by deferring non-critical initialization until after first render. Initialize only essential services at launch (authentication, core navigation), load feature-specific code when needed, defer SDK initialization (analytics, crash reporting) by 2-3 seconds, use dynamic imports/lazy modules, and load images asynchronously with placeholders. Lazy loading reduces startup time by 40-60%.
Should you optimize warm start vs cold start?
Optimize both in mobile app development, but prioritize cold start—it’s the first impression and represents worst-case performance. Cold start (app not in memory): optimize initialization, reduce binary size, minimize work before first frame. Warm start (app in memory): optimize view restoration, implement proper state persistence. Users experience cold starts after device reboot and app updates.
Push notifications, real-time sync, and user data all need solid cloud backing. Cloud Geeks handles the server side so your app performs at its best.
Ganda Tech Services brings together cloud infrastructure, web development, and mobile app expertise to help Australian businesses thrive in the digital economy.
Talk to a Sydney app developer — free.
30 minutes. We'll tell you what your app needs, how long it takes, and what it costs. Real answers, no sales pitch.
Book Free App Strategy Call →Free · 30 minutes · No obligation