Introduction
Sixty frames per second. It’s the gold standard for mobile app performance. At 60fps, animations feel fluid, scrolling feels natural, and user interactions feel instantaneous. Drop below that threshold, and users immediately notice something’s off—even if they can’t articulate exactly what’s wrong.
In October 2024, achieving consistent 60fps performance is more critical than ever. Users compare your app to the best experiences on their devices: iOS’s buttery-smooth animations, Android’s Material Design polish, and games that lock at 60fps without breaking a sweat. If your app feels janky, users will abandon it—often within the first few interactions.
This guide provides a comprehensive approach to mobile performance optimization. We’ll cover profiling tools, optimization techniques for both native and React Native apps, platform-specific considerations, and practical code examples. Whether you’re building a consumer app, an enterprise tool, or anything in between, these techniques will help you achieve and maintain that crucial 60fps target.
Understanding the 60fps Target
The Frame Budget
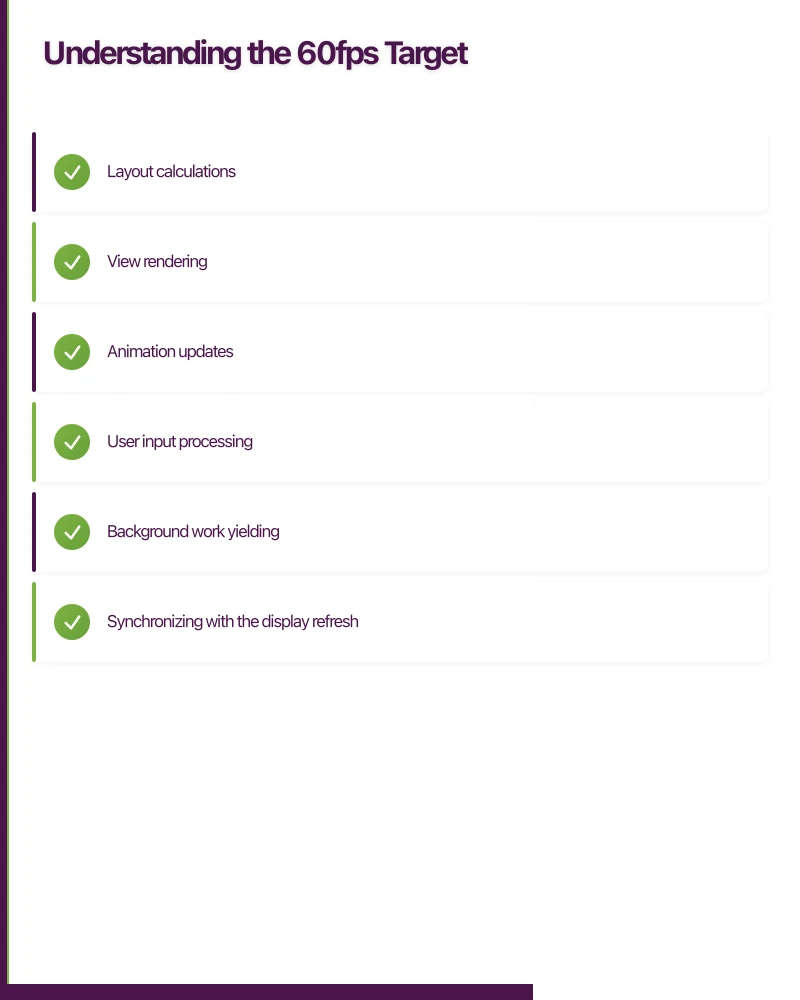
At 60fps, your app has 16.67 milliseconds to complete everything needed to render a single frame:
- Layout calculations
- View rendering
- Animation updates
- User input processing
- Background work yielding
Exceed that budget, and you drop frames. Users perceive dropped frames as stuttering, lag, or jank. Even a few dropped frames can make an app feel sluggish.
The Reality:
In practice, you have less than 16.67ms. The system needs time for:
- Synchronizing with the display refresh
- Compositing layers
- GPU rendering
This leaves you with roughly 10-12ms of actual work time per frame. Every millisecond counts.
When 60fps Matters Most
Not every screen needs perfect 60fps performance, but these interactions absolutely do:
Critical Interactions:
- Scrolling lists and feeds (the most common interaction)
- Gesture-driven navigation (swipes, drags)
- Pull-to-refresh animations
- Page transitions and navigation
- Interactive animations (button presses, toggles)
- Real-time updates (chat, notifications)
Less Critical:
- Static screens with no animations
- One-time loading screens
- Settings pages
- Forms (when not animating)
Focus your optimization efforts where frame rate impacts user perception most.
Platform Differences
iOS:
- ProMotion displays: 120Hz on iPad Pro and iPhone 13 Pro+
- Strict 60fps expectation on non-ProMotion devices
- UIKit highly optimized for smooth scrolling
- Core Animation runs on separate thread
- Users extremely sensitive to frame drops
Android:
- Variable refresh rates (60Hz-120Hz depending on device)
- More tolerance for occasional frame drops (historically)
- Material Design emphasizes smooth motion
- Render pipeline more complex than iOS
- Greater device fragmentation means testing critical
React Native:
- JavaScript bridge can be a bottleneck
- New Architecture (Fabric) significantly improves frame rate
- Requires more careful optimization than native
- Frame drops more common under heavy JavaScript load
Profiling Performance: Tools and Te
 chniques
You can’t optimize what you don’t measure. Before diving into fixes, establish a baseline and identify bottlenecks.
iOS Profiling Tools
Instruments (Time Profiler)
The most powerful iOS profiling tool:
# Profile your app from command line
xcodebuild -project YourApp.xcodeproj \
  -scheme YourScheme \
  -configuration Release \
  -destination 'platform=iOS Simulator,name=iPhone 15' \
  | xcpretty

# Then open in Instruments:
# Product -> Profile in Xcode (⌘I)
Key Instruments templates:
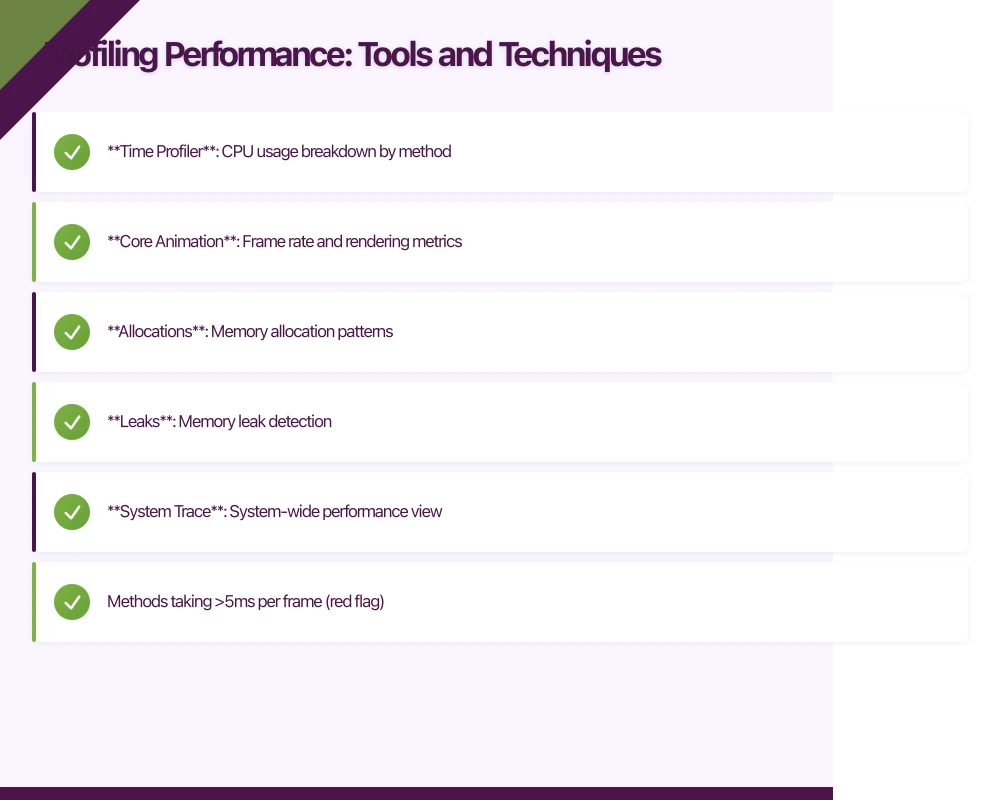
- Time Profiler: CPU usage breakdown by method
- Core Animation: Frame rate and rendering metrics
- Allocations: Memory allocation patterns
- Leaks: Memory leak detection
- System Trace: System-wide performance view
Reading Time Profiler Results:
Look for:
- Methods taking over 5ms per frame (red flag)
- Repeated expensive operations in loops
- Main thread blocking
- Excessive allocations
Core Animation Debug Options
Enable in Simulator or on device:
// In debug builds, enable FPS counter
#if DEBUG
CADisplayLink.shared.preferredFramesPerSecond = 60
#endif
Xcode Debug Options:
- Color Blended Layers (red = expensive blending)
- Color Offscreen-Rendered (yellow = expensive)
- Color Copied Images (blue = non-optimal format)
FPS Monitor
Add a simple FPS counter during development:
class FPSMonitor {
    private var displayLink: CADisplayLink?
    private var lastTimestamp: CFTimeInterval = 0
    private var frames = 0

    func start() {
        displayLink = CADisplayLink(target: self,
                                    selector: #selector(displayLinkTick))
        displayLink?.add(to: .main, forMode: .common)
    }

    @objc private func displayLinkTick(_ link: CADisplayLink) {
        if lastTimestamp == 0 {
            lastTimestamp = link.timestamp
            return
        }

        frames += 1
        let elapsed = link.timestamp - lastTimestamp

        if elapsed >= 1.0 {
            let fps = Double(frames) / elapsed
            print("FPS: \(Int(fps))")
            frames = 0
            lastTimestamp = link.timestamp
        }
    }
}
Android Profiling Tools
Android Studio Profiler
Built-in profiling with real-time data:
# Enable profiling
./gradlew installDebug

# Profile via Android Studio:
# View -> Tool Windows -> Profiler
Profiler sections:
- CPU: Method traces and call charts
- Memory: Heap dump and allocation tracking
- Network: Request/response inspection
- Energy: Battery impact analysis
GPU Rendering Profile
Enable on-device:
Settings -> Developer Options -> Monitoring -> Profile GPU Rendering -> On Screen as Bars
Reading the bars:
Each vertical bar represents one frame. The horizontal green line is the 16ms threshold.
- Purple: Time in View.onDraw()
- Blue: Time in View.onMeasure() and View.onLayout()
- Orange: Time in processing
- Red: Time waiting on previous frame
Bars exceeding the green line indicate dropped frames.
Systrace
System-wide performance capture:
# Capture 10 seconds of trace data
python systrace.py --time=10 -o trace.html \
  sched gfx view wm am app

# Open trace.html in Chrome at chrome://tracing
Systrace shows:
- Frame rendering pipeline
- Thread activity
- System events
- Scheduling delays
Layout Inspector
Analyze view hierarchy in real-time:
# Tools -> Layout Inspector in Android StudioLook for:
- Deep view hierarchies (over 10 levels = problematic)
- Unnecessary nested layouts
- Overdraw issues
React Native Profiling
Performance Monitor
Enable in-app:
// Shake device -> Enable Performance Monitor
// Shows:
// - JavaScript frame rate
// - UI frame rate (native)
// - Memory usage
React DevTools Profiler
Profile component renders:
npm install --save-dev react-devtools
npx react-devtools
import { Profiler } from 'react';
function onRenderCallback(
id,
phase,
actualDuration,
baseDuration,
startTime,
commitTime,
) {
console.log(`${id} (${phase}) took ${actualDuration}ms`);
}
<Profiler id="ProductList" onRender={onRenderCallback}>
<ProductList />
</Profiler>Flipper
Meta’s debugging platform with performance plugins:
npm install --save-dev react-native-flipperFlipper provides:
- Network inspector
- Layout inspector
- Crash reporter
- Performance metrics
- Hermes debugger
Hermes Profiling
For React Native apps using Hermes:
# Enable Hermes profiling
react-native profile-hermes

# Download and analyze
npx react-native profile-hermes <path-to-hermes-profile>
Establishing Performance Baselines
Before optimizing, document current performance:
1. Define Key User Flows
Example flows to measure:
- App cold start -> first screen visible
- Navigate from home -> product detail
- Scroll through feed (100 items)
- Submit form -> response displayed
- Open drawer/modal -> fully animated
2. Measure on Representative Devices
Don’t just test on flagships:
iOS devices:
- iPhone SE (budget option)
- iPhone 12/13 (common)
- iPhone 15 Pro (latest)
Android devices:
- Samsung Galaxy A-series (mid-range, very common)
- Google Pixel 6/7 (clean Android)
- Budget device (under $300 AUD)
3. Record Baseline Metrics
// Example baseline document
const performanceBaseline = {
  coldStart: {
    target: "< 2000ms",
    current: {
      iPhoneSE: "2400ms", // [x] Exceeds target
      iPhone13: "1800ms", // [x]
      GalaxyA54: "2100ms", // [x] Exceeds target
    }
  },
  feedScroll: {
    target: "60fps (consistent)",
    current: {
      iPhoneSE: "55fps", // [x] Below target
      iPhone13: "60fps", // [x]
      GalaxyA54: "52fps", // [x] Below target
    }
  },
  navigationTransition: {
    target: "< 300ms, 60fps",
    current: {
      iPhoneSE: "350ms, 57fps", // [x]
      iPhone13: "280ms, 60fps", // [x]
      GalaxyA54: "400ms, 54fps", // [x]
    }
  }
};
4. Identify Bottlenecks
Use profiling data to find:
- Methods consuming over 10% of frame time
- Main thread blocking operations
- Excessive re-renders (React Native)
- Memory allocations in hot paths
- Overdraw and unnecessary rendering
Now you’re ready to optimize.
Optimization Tec
 hniques: Universal Principles
These techniques apply across native and React Native apps.
1. Flatten View Hierarchies
The Problem:
Deep view nesting causes expensive layout calculations:
{/* DON'T: 8 levels deep */}
<LinearLayout>
  <RelativeLayout>
    <FrameLayout>
      <LinearLayout>
        <RelativeLayout>
          <FrameLayout>
            <LinearLayout>
              <TextView />
            </LinearLayout>
          </FrameLayout>
        </RelativeLayout>
      </LinearLayout>
    </FrameLayout>
  </RelativeLayout>
</LinearLayout>
Every level adds:
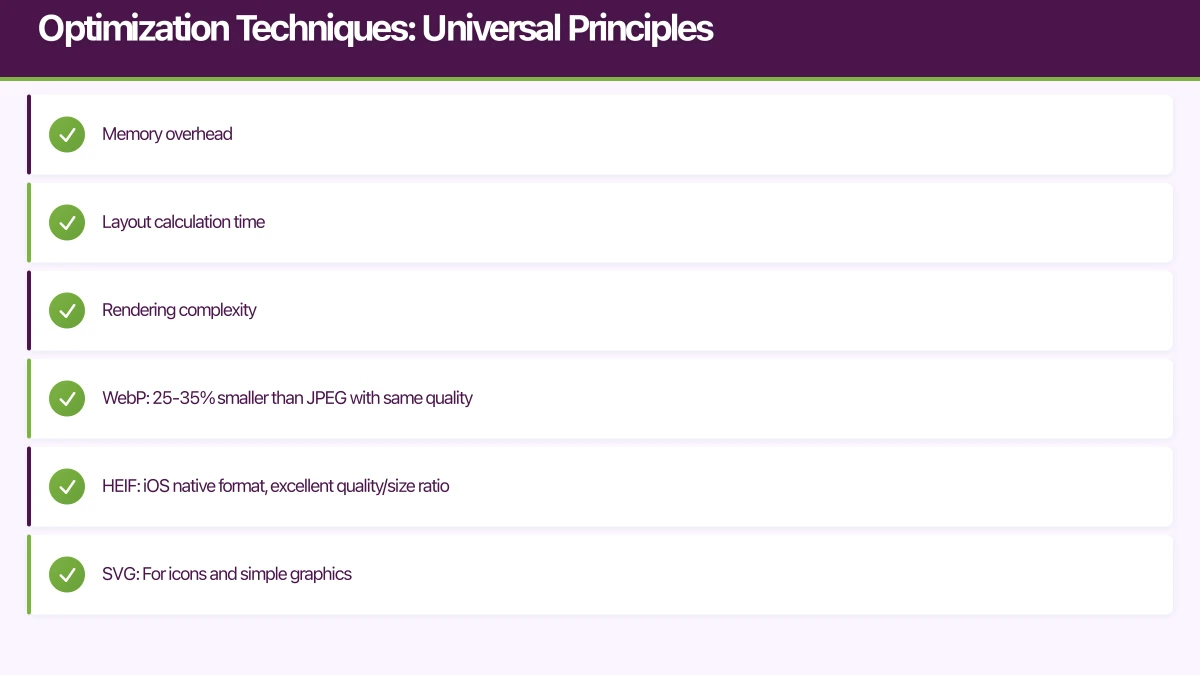
- Memory overhead
- Layout calculation time
- Rendering complexity
The Solution:
Flatten using modern layout systems:
{/* DO: 2 levels with ConstraintLayout */}
<androidx.constraintlayout.widget.ConstraintLayout>
  <TextView
    app:layout_constraintTop_toTopOf="parent"
    app:layout_constraintStart_toStartOf="parent" />
</androidx.constraintlayout.widget.ConstraintLayout>
React Native equivalent:
// DON'T: Unnecessary nesting
<View>
  <View>
    <View>
      <View>
        <Text>Hello</Text>
      </View>
    </View>
  </View>
</View>

// DO: Flat structure
<View style={styles.container}>
  <Text>Hello</Text>
</View>
Impact: 20-30% improvement in layout time for complex screens.
2. Eliminate Overdraw
The Problem:
Drawing the same pixels multiple times wastes GPU cycles:
// DON'T: Multiple overlapping backgrounds
<View style={{ backgroundColor: 'white' }}>
  <View style={{ backgroundColor: 'white' }}>
    <View style={{ backgroundColor: 'white' }}>
      <Text>Content</Text>
    </View>
  </View>
</View>
Each View draws its background, even though only the top one is visible.
The Solution:
Remove unnecessary backgrounds:
// DO: Only the necessary background
<View style={{ backgroundColor: 'white' }}>
  <View>
    <View>
      <Text>Content</Text>
    </View>
  </View>
</View>
Use transparency wisely:
// iOS: Opaque views render faster
view.isOpaque = true
view.backgroundColor = .white // Not clear

// Android
view.setBackgroundColor(Color.WHITE) // Not transparent
Impact: 15-20% improvement in GPU rendering time.
3. Optimize Images Aggressively
Images are the biggest performance killer in most apps.
Load Appropriate Sizes:
// DON'T: Load full-res 3000x3000 image for 100x100 display
<Image
  source={{ uri: 'https://cdn.example.com/product-full.jpg' }}
  style={{ width: 100, height: 100 }}
/>

// DO: Request appropriately sized image
<Image
  source={{ uri: 'https://cdn.example.com/product-thumbnail-200.jpg' }}
  style={{ width: 100, height: 100 }}
/>
Use Efficient Formats:
- WebP: 25-35% smaller than JPEG with same quality
- HEIF: iOS native format, excellent quality/size ratio
- SVG: For icons and simple graphics
Implement Lazy Loading:
// React Native with lazy loading
import { Image } from 'react-native';
import { useState, useEffect } from 'react';

function LazyImage({ uri, placeholder, style }) {
  const [source, setSource] = useState({ uri: placeholder });
  const [loading, setLoading] = useState(true);

  useEffect(() => {
    // Load image when component mounts
    Image.prefetch(uri).then(() => {
      setSource({ uri });
      setLoading(false);
    });
  }, [uri]);

  return (
    <Image
      source={source}
      style={[style, loading && styles.placeholder]}
    />
  );
}
Cache Decoded Images:
// iOS: Use NSCache for decoded images
let cache = NSCache<NSString, UIImage>()

func loadImage(url: URL, completion: @escaping (UIImage?) -> Void) {
    let key = url.absoluteString as NSString

    // Check cache first
    if let cached = cache.object(forKey: key) {
        completion(cached)
        return
    }

    // Load and cache
    URLSession.shared.dataTask(with: url) { data, _, _ in
        guard let data = data,
              let image = UIImage(data: data) else {
            completion(nil)
            return
        }

        self.cache.setObject(image, forKey: key)
        completion(image)
    }.resume()
}
Impact: 40-60% improvement in memory usage and rendering time.
4. Virtualize Long Lists
Never render all items at once.
React Native FlatList:
import { FlatList } from 'react-native';

function ProductFeed({ products }) {
  const renderItem = ({ item }) => (
    <ProductCard product={item} />
  );

  return (
    <FlatList
      data={products}
      renderItem={renderItem}
      keyExtractor={item => item.id}

      // Performance optimizations
      removeClippedSubviews={true} // Unmount off-screen items
      maxToRenderPerBatch={10} // Render 10 items per batch
      updateCellsBatchingPeriod={50} // 50ms between batches
      initialNumToRender={10} // Render 10 initially
      windowSize={5} // Keep 5 screens worth in memory

      // Get item layout for better scrolling
      getItemLayout={(data, index) => ({
        length: 200, // Item height
        offset: 200 * index,
        index,
      })}
    />
  );
}
iOS UICollectionView:
class ProductFeedController: UICollectionViewController {
    override func viewDidLoad() {
        super.viewDidLoad()

        // Use prefetching for smoother scrolling
        collectionView.isPrefetchingEnabled = true
        collectionView.prefetchDataSource = self

        // Configure layout
        let layout = UICollectionViewFlowLayout()
        layout.estimatedItemSize = CGSize(width: 100, height: 200)
        layout.minimumLineSpacing = 10
        collectionView.collectionViewLayout = layout
    }
}

extension ProductFeedController: UICollectionViewDataSourcePrefetching {
    func collectionView(_ collectionView: UICollectionView,
                       prefetchItemsAt indexPaths: [IndexPath]) {
        // Prefetch data for smooth scrolling
        let urls = indexPaths.compactMap { products[$0.item].imageURL }
        ImagePrefetcher.shared.prefetch(urls: urls)
    }
}
Android RecyclerView:
class ProductFeedActivity : AppCompatActivity() {
    override fun onCreate(savedInstanceState: Bundle?) {
        super.onCreate(savedInstanceState)

        val recyclerView = findViewById<RecyclerView>(R.id.recyclerView)

        // Optimize RecyclerView
        recyclerView.apply {
            // Use stable IDs for consistent tracking
            adapter = ProductAdapter().apply { setHasStableIds(true) }

            // Enable nested scrolling
            isNestedScrollingEnabled = true

            // Set item animator for smooth animations
            itemAnimator = DefaultItemAnimator()

            // Prefetch items for smooth scrolling
            layoutManager = LinearLayoutManager(context).apply {
                isItemPrefetchEnabled = true
                initialPrefetchItemCount = 4
            }

            // Reuse view pool across multiple RecyclerViews
            setRecycledViewPool(sharedViewPool)
        }
    }
}
Impact: 70-80% improvement in scrolling performance for long lists.
5. Debounce and Throttle Expensive Operations
Prevent excessive work from rapid user input.
Debouncing (wait for user to finish):
import { useState, useEffect } from 'react';

function useDebounce(value, delay) {
  const [debouncedValue, setDebouncedValue] = useState(value);

  useEffect(() => {
    const handler = setTimeout(() => {
      setDebouncedValue(value);
    }, delay);

    return () => clearTimeout(handler);
  }, [value, delay]);

  return debouncedValue;
}

// Usage in search
function SearchScreen() {
  const [searchTerm, setSearchTerm] = useState('');
  const debouncedSearch = useDebounce(searchTerm, 300);

  useEffect(() => {
    if (debouncedSearch) {
      // Only search after user stops typing for 300ms
      performSearch(debouncedSearch);
    }
  }, [debouncedSearch]);

  return (
    <TextInput
      value={searchTerm}
      onChangeText={setSearchTerm}
      placeholder="Search products..."
    />
  );
}
Throttling (limit frequency):
function useThrottle(callback, delay) {
  const lastRun = useRef(Date.now());

  return useCallback((...args) => {
    const now = Date.now();
    if (now - lastRun.current >= delay) {
      callback(...args);
      lastRun.current = now;
    }
  }, [callback, delay]);
}

// Usage in scroll tracking
function FeedScreen() {
  const trackScroll = useThrottle((offset) => {
    analytics.track('scroll_position', { offset });
  }, 1000); // Only track once per second

  return (
    <FlatList
      data={items}
      onScroll={(e) => trackScroll(e.nativeEvent.contentOffset.y)}
    />
  );
}
Impact: 50-70% reduction in unnecessary operations.
Platform-Specific Optimization: iOS
Use Core Animation for Smooth Animations
Core Animation runs on a separate thread from the main thread, enabling smooth 60fps animations even when JavaScript is busy.
// Animate transform with Core Animation
let animation = CABasicAnimation(keyPath: "transform.scale")
animation.fromValue = 1.0
animation.toValue = 1.2
animation.duration = 0.3
animation.timingFunction = CAMediaTimingFunction(name: .easeInEaseOut)

view.layer.add(animation, forKey: "scale")
React Native equivalent using Reanimated:
import Animated, {
  useSharedValue,
  useAnimatedStyle,
  withSpring
} from 'react-native-reanimated';

function AnimatedButton() {
  const scale = useSharedValue(1);

  const animatedStyle = useAnimatedStyle(() => ({
    transform: [{ scale: scale.value }]
  }));

  const handlePress = () => {
    // Runs on UI thread, not JavaScript thread
    scale.value = withSpring(1.2);
  };

  return (
    <Animated.View style={animatedStyle}>
      <Pressable onPress={handlePress}>
        <Text>Press me</Text>
      </Pressable>
    </Animated.View>
  );
}
Optimize Auto Layout Constraints
Auto Layout is convenient but can be expensive for complex layouts.
// DON'T: Creating constraints in a loop
for i in 0..less than 100 {
    let view = UIView()
    view.translatesAutoresizingMaskIntoConstraints = false
    containerView.addSubview(view)

    NSLayoutConstraint.activate([
        view.leadingAnchor.constraint(equalTo: containerView.leadingAnchor),
        view.topAnchor.constraint(equalTo: containerView.topAnchor,
                                   constant: CGFloat(i * 50)),
        view.widthAnchor.constraint(equalToConstant: 100),
        view.heightAnchor.constraint(equalToConstant: 40)
    ])
}

// DO: Use manual layout for performance-critical views
override func layoutSubviews() {
    super.layoutSubviews()

    for (index, view) in subviews.enumerated() {
        let y = CGFloat(index) * 50
        view.frame = CGRect(x: 0, y: y, width: 100, height: 40)
    }
}
Enable Rasterization for Static Content
// Rasterize complex static views
complexView.layer.shouldRasterize = true
complexView.layer.rasterizationScale = UIScreen.main.scale

// ⚠️ Don't rasterize animated content
// Rasterization creates a cached bitmap, defeating the purpose if content changes
Use Metal for Graphics-Intensive Operations
For custom graphics rendering:
import MetalKit

class MetalView: MTKView {
    var commandQueue: MTLCommandQueue!

    override init(frame: CGRect, device: MTLDevice?) {
        super.init(frame: frame, device: device ?? MTLCreateSystemDefaultDevice())
        commandQueue = self.device?.makeCommandQueue()
    }

    // Metal renders at native frame rate with GPU
    override func draw(_ rect: CGRect) {
        guard let drawable = currentDrawable,
              let commandBuffer = commandQueue.makeCommandBuffer(),
              let descriptor = currentRenderPassDescriptor else {
            return
        }

        // GPU-accelerated rendering
        let renderEncoder = commandBuffer.makeRenderCommandEncoder(
            descriptor: descriptor
        )
        // ... rendering commands
        renderEncoder?.endEncoding()

        commandBuffer.present(drawable)
        commandBuffer.commit()
    }
}
Platform-Specific Optimization: Android
Use ConstraintLayout for Flat Hierarchies
ConstraintLayout lets you create complex layouts without nesting:
{/* Single flat layout instead of nested LinearLayouts */}
<androidx.constraintlayout.widget.ConstraintLayout
    android:layout_width="match_parent"
    android:layout_height="wrap_content">

    <ImageView
        android:id="@+id/thumbnail"
        android:layout_width="80dp"
        android:layout_height="80dp"
        app:layout_constraintStart_toStartOf="parent"
        app:layout_constraintTop_toTopOf="parent" />

    <TextView
        android:id="@+id/title"
        android:layout_width="0dp"
        android:layout_height="wrap_content"
        app:layout_constraintStart_toEndOf="@id/thumbnail"
        app:layout_constraintEnd_toEndOf="parent"
        app:layout_constraintTop_toTopOf="@id/thumbnail" />

    <TextView
        android:id="@+id/subtitle"
        android:layout_width="0dp"
        android:layout_height="wrap_content"
        app:layout_constraintStart_toStartOf="@id/title"
        app:layout_constraintEnd_toEndOf="parent"
        app:layout_constraintTop_toBottomOf="@id/title" />

</androidx.constraintlayout.widget.ConstraintLayout>
Optimize RecyclerView Performance
class ProductAdapter : RecyclerView.Adapter<ProductViewHolder>() {

    // Use stable IDs for consistent item tracking
    init {
        setHasStableIds(true)
    }

    override fun getItemId(position: Int): Long {
        return products[position].id.toLong()
    }

    override fun onCreateViewHolder(parent: ViewGroup, viewType: Int): ProductViewHolder {
        val view = LayoutInflater.from(parent.context)
            .inflate(R.layout.item_product, parent, false)
        return ProductViewHolder(view)
    }

    override fun onBindViewHolder(holder: ProductViewHolder, position: Int) {
        holder.bind(products[position])
    }
}

class ProductViewHolder(itemView: View) : RecyclerView.ViewHolder(itemView) {
    private val thumbnail: ImageView = itemView.findViewById(R.id.thumbnail)
    private val title: TextView = itemView.findViewById(R.id.title)

    fun bind(product: Product) {
        // Use Coil or Glide for efficient image loading
        thumbnail.load(product.imageUrl) {
            crossfade(true)
            placeholder(R.drawable.placeholder)
            size(200) // Load appropriately sized image
        }
        title.text = product.name
    }
}
Use Hardware Acceleration
Ensure hardware acceleration is enabled:
{/* AndroidManifest.xml */}
<application
    android:hardwareAccelerated="true">
    {/* Your activities */}
</application>
// Enable for specific views if needed
view.setLayerType(View.LAYER_TYPE_HARDWARE, null)
// For complex animations
view.animate()
.alpha(0f)
.withLayer() // Enables hardware layer during animation
.setDuration(300)
.start()Optimize Bitmap Loading
fun decodeSampledBitmap(res: Resources, resId: Int, reqWidth: Int, reqHeight: Int): Bitmap {
    // First decode with inJustDecodeBounds=true to check dimensions
    return BitmapFactory.Options().run {
        inJustDecodeBounds = true
        BitmapFactory.decodeResource(res, resId, this)

        // Calculate inSampleSize
        inSampleSize = calculateInSampleSize(this, reqWidth, reqHeight)

        // Decode bitmap with inSampleSize set
        inJustDecodeBounds = false

        BitmapFactory.decodeResource(res, resId, this)
    }
}

fun calculateInSampleSize(options: BitmapFactory.Options, reqWidth: Int, reqHeight: Int): Int {
    val (height: Int, width: Int) = options.run { outHeight to outWidth }
    var inSampleSize = 1

    if (height > reqHeight || width > reqWidth) {
        val halfHeight: Int = height / 2
        val halfWidth: Int = width / 2

        while (halfHeight / inSampleSize >= reqHeight &&
               halfWidth / inSampleSize >= reqWidth) {
            inSampleSize *= 2
        }
    }

    return inSampleSize
}
React Native Specific Optimization
Enable Hermes Engine
Hermes significantly improves startup time and reduces memory usage:
// android/app/build.gradle
project.ext.react = [
    enableHermes: true  // Enable Hermes
]

// iOS: Edit ios/Podfile
:hermes_enabled => true
Benefits:
- 50% faster startup on Android
- 30% less memory usage
- Bytecode compilation improves load time
Use the New Architecture (Fabric + TurboModules)
Enable for dramatic performance improvements:
# iOS
cd ios
RCT_NEW_ARCH_ENABLED=1 bundle exec pod install

# Android
# Edit android/gradle.properties
newArchEnabled=true
See our detailed guide: React Native 0.73: New Architecture and Performance Improvements
Minimize Bridge Crossings
Every call from JavaScript to native goes through the bridge, causing delays.
// DON'T: Multiple bridge crossings in a loop
items.forEach(item => {
  NativeModules.Storage.setItem(item.key, item.value); // Bridge call
});

// DO: Batch operations
NativeModules.Storage.setItems(items); // Single bridge call
Use React.memo and useMemo
Prevent unnecessary re-renders:
import { memo, useMemo } from 'react';

// Memoize expensive components
const ProductCard = memo(({ product, onPress }) => {
  return (
    <Pressable onPress={() => onPress(product.id)}>
      <Image source={{ uri: product.imageUrl }} />
      <Text>{product.name}</Text>
      <Text>${product.price}</Text>
    </Pressable>
  );
}, (prevProps, nextProps) => {
  // Only re-render if product changed
  return prevProps.product.id === nextProps.product.id &&
         prevProps.product.name === nextProps.product.name;
});

// Memoize expensive calculations
function ProductList({ products, filters }) {
  const filteredProducts = useMemo(() => {
    return products.filter(p =>
      filters.every(f => f.predicate(p))
    );
  }, [products, filters]); // Only recalculate when these change

  return (
    <FlatList
      data={filteredProducts}
      renderItem={({ item }) => <ProductCard product={item} />}
    />
  );
}
Move Heavy Work to Native Modules
For CPU-intensive operations, implement in native code:
// Slow: Image processing in JavaScript
function processImageJS(imageData) {
  // Slow pixel manipulation in JS
  for (let i = 0; i < imageData.length; i += 4) {
    imageData[i] = imageData[i] * 1.2; // Red
    imageData[i + 1] = imageData[i + 1] * 1.1; // Green
    imageData[i + 2] = imageData[i + 2] * 0.9; // Blue
  }
  return imageData;
}

// Fast: Image processing in native code
import { NativeModules } from 'react-native';
const { ImageProcessor } = NativeModules;

async function processImageNative(imageUri) {
  // Native code is 10-50x faster for CPU-intensive work
  return await ImageProcessor.processImage(imageUri);
}
Testing and Validation
Automated Performance Testing
iOS with XCTest:
import XCTest

class PerformanceTests: XCTestCase {
    func testScrollPerformance() {
        let app = XCUIApplication()
        app.launch()

        let table = app.tables.firstMatch

        measure(metrics: [XCTOSSignpostMetric.scrollDecelerationMetric]) {
            table.swipeUp(velocity: .fast)
        }
    }

    func testAppLaunchTime() {
        measure(metrics: [XCTApplicationLaunchMetric()]) {
            XCUIApplication().launch()
        }
    }
}
Android with Macrobenchmark:
@RunWith(AndroidJUnit4::class)
class ScrollBenchmark {
    @get:Rule
    val benchmarkRule = MacrobenchmarkRule()

    @Test
    fun scrollProductList() {
        benchmarkRule.measureRepeated(
            packageName = "com.yourapp",
            metrics = listOf(FrameTimingMetric()),
            iterations = 5,
            setupBlock = {
                pressHome()
            }
        ) {
            startActivityAndWait()

            val list = device.findObject(By.res("product_list"))
            list.fling(Direction.DOWN)
            device.waitForIdle()
        }
    }
}
Real-World Performance Monitoring
Use Firebase Performance Monitoring:
import perf from '@react-native-firebase/perf';

// Track custom traces
async function loadProducts() {
  const trace = await perf().startTrace('load_products');

  try {
    const products = await fetchProducts();
    trace.putMetric('product_count', products.length);
    return products;
  } finally {
    await trace.stop();
  }
}

// Automatic monitoring of HTTP requests
// Firebase automatically tracks network performance
Performance Budgets
Set and enforce performance budgets:
// performance-budget.js
module.exports = {
  coldStart: {
    target: 2000, // ms
    devices: {
      'iPhone SE': 2000,
      'iPhone 13': 1500,
      'Samsung A54': 2200,
    }
  },
  navigationTransition: {
    target: 300, // ms at 60fps
    tolerance: 50
  },
  listScrolling: {
    target: 60, // fps
    minimumAcceptable: 55
  },
  memoryUsage: {
    target: 150, // MB
    maximum: 200
  }
};
Conclusion
Achieving consistent 60fps performance on mobile requires discipline, measurement, and continuous optimization. The techniques in this guide provide a comprehensive foundation:
Key Takeaways:
- Measure first: Profile before optimizing to identify actual bottlenecks
- Focus on what matters: Optimize scrolling, animations, and transitions
- Flatten hierarchies: Reduce layout complexity for faster rendering
- Optimize images: Load appropriate sizes, use efficient formats, cache aggressively
- Virtualize lists: Never render more than what’s visible
- Platform-specific tools: Use Metal/Core Animation on iOS, hardware layers on Android
- React Native: Enable Hermes and New Architecture, minimize bridge crossings
- Test on real devices: Simulators don’t reflect real-world performance
- Monitor in production: Track performance metrics from actual users
- Maintain performance: Make it part of your development process, not a one-time effort
In October 2024, users expect smooth, responsive apps. By applying these optimization techniques systematically, you can deliver the 60fps experience users demand—and keep them coming back to your app.
Performance isn’t a feature you add at the end. It’s a discipline you practice throughout development. Start measuring today, optimize systematically, and build apps that feel as good as they look.
Need to set up CI/CD pipelines for your app builds? Cloud Geeks provides DevOps and cloud infrastructure services for development teams.
Ganda Tech Services brings together cloud infrastructure, web development, and mobile app expertise to help Australian businesses thrive in the digital economy.
Talk to a Sydney app developer — free.
30 minutes. We'll tell you what your app needs, how long it takes, and what it costs. Real answers, no sales pitch.
Book Free App Strategy Call →Free · 30 minutes · No obligation