If your mobile app feels sluggish, drops frames during scrolling, or drains battery faster than your users’ patience, you’re losing customers. In 2024, users expect buttery-smooth 60fps performance as a baseline—anything less feels broken.
After profiling and optimizing dozens of production apps across Android and iOS, I’ve learned that performance isn’t about one magic fix. It’s about understanding the rendering pipeline, managing memory intelligently, and using the right profiling tools to identify bottlenecks. This guide covers the practical techniques that actually move the needle.
Understanding the 60fps Benchmark
Every frame needs to render in 16.67 milliseconds to achieve 60fps. Miss that deadline, and users see janky animations and stuttering scrolls. This isn’t just about aesthetics—Google’s research shows that users abandon apps with poor performance at significantly higher rates.
The rendering pipeline on both platforms works similarly:
- UI thread processes touch events and layout
- Render thread (iOS) or RenderThread (Android) builds display lists
- GPU rasterizes and composites the final frame
Block any part of this pipeline for more than 16ms, and you drop frames. The challenge is identifying where the blockage occurs.
Platform-Specific Frame Timing
iOS uses CADisplayLink to sync with the display’s refresh rate (60Hz on most devices, 120Hz on ProMotion displays). Android’s Choreographer class provides similar functionality, coordinating animations and input with the display’s vsync signal.
// iOS: Monitor frame timing with CADisplayLink
class PerformanceMonitor {
    private var displayLink: CADisplayLink?
    private var lastTimestamp: CFTimeInterval = 0

    func startMonitoring() {
        displayLink = CADisplayLink(target: self, selector: #selector(frameUpdate))
        displayLink?.add(to: .main, forMode: .common)
    }

    @objc private func frameUpdate(displayLink: CADisplayLink) {
        let currentTimestamp = displayLink.timestamp
        let frameDuration = currentTimestamp - lastTimestamp

        if frameDuration > 0.0167 { // Dropped frame threshold
            print("⚠️ Dropped frame: \(frameDuration * 1000)ms")
        }

        lastTimestamp = currentTimestamp
    }
}
// Android: Monitor frame metrics with FrameMetricsAggregator
import androidx.core.app.FrameMetricsAggregator
class PerformanceMonitor(private val activity: Activity) {
private val metricsAggregator = FrameMetricsAggregator()
fun startMonitoring() {
metricsAggregator.add(activity)
}
fun getFrameMetrics(): SparseIntArray {
// Returns histogram of frame durations
return metricsAggregator.getMetrics()?.get(FrameMetricsAggregator.TOTAL_DURATION)
?: SparseIntArray()
}
fun logSlowFrames() {
val metrics = getFrameMetrics()
for (i in 0 until metrics.size()) {
val frameDuration = metrics.keyAt(i)
val frameCount = metrics.valueAt(i)
if (frameDuration > 16) { // Frames slower than 16ms
println("⚠️ $frameCount frames took ${frameDuration}ms")
}
}
}
}Rendering Optimization: The Main Performance B
 attleground
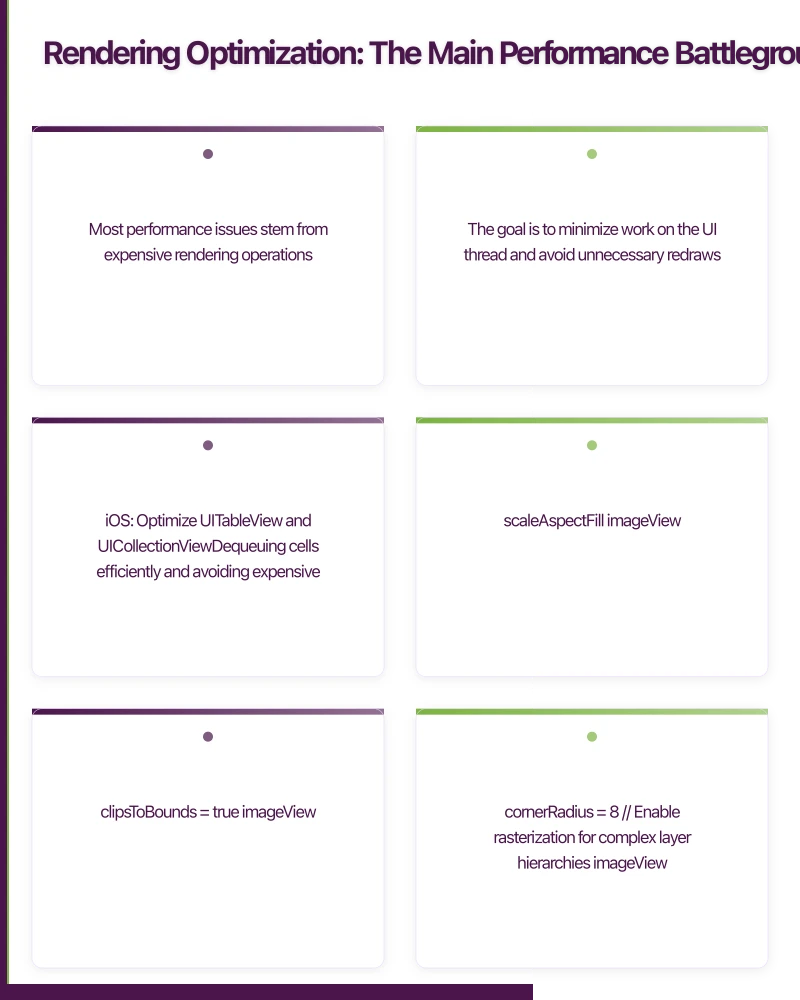
Most performance issues stem from expensive rendering operations. The goal is to minimize work on the UI thread and avoid unnecessary redraws.
iOS: Optimize UITableView and UICollectionView
Dequeuing cells efficiently and avoiding expensive operations in cellForRowAt is critical. Here’s a pattern that works consistently:
class OptimizedTableViewCell: UITableViewCell {
    static let identifier = "OptimizedCell"

    // Use lazy properties for expensive views
    private lazy var thumbnailImageView: UIImageView = {
        let imageView = UIImageView()
        imageView.contentMode = .scaleAspectFill
        imageView.clipsToBounds = true
        imageView.layer.cornerRadius = 8
        // Enable rasterization for complex layer hierarchies
        imageView.layer.shouldRasterize = true
        imageView.layer.rasterizationScale = UIScreen.main.scale
        return imageView
    }()

    func configure(with item: Item) {
        // Avoid heavy computation in configure
        titleLabel.text = item.title

        // Load images asynchronously
        ImageCache.shared.loadImage(from: item.imageURL) { [weak self] image in
            DispatchQueue.main.async {
                self?.thumbnailImageView.image = image
            }
        }
    }

    override func prepareForReuse() {
        super.prepareForReuse()
        // Cancel any pending operations
        thumbnailImageView.image = nil
    }
}

// In your view controller
func tableView(_ tableView: UITableView, cellForRowAt indexPath: IndexPath) -> UITableViewCell {
    let cell = tableView.dequeueReusableCell(
        withIdentifier: OptimizedTableViewCell.identifier,
        for: indexPath
    ) as! OptimizedTableViewCell

    cell.configure(with: items[indexPath.row])
    return cell
}
Android: RecyclerView Optimization
RecyclerView performs better than ListView, but only if configured correctly:
class OptimizedAdapter(private val items: List<Item>) :
    RecyclerView.Adapter<OptimizedAdapter.ViewHolder>() {

    // Enable stable IDs for better diffing
    init {
        setHasStableIds(true)
    }

    override fun getItemId(position: Int): Long {
        return items[position].id.hashCode().toLong()
    }

    class ViewHolder(view: View) : RecyclerView.ViewHolder(view) {
        private val thumbnailImageView: ImageView = view.findViewById(R.id.thumbnail)
        private val titleTextView: TextView = view.findViewById(R.id.title)

        fun bind(item: Item) {
            titleTextView.text = item.title

            // Use Glide or Coil for efficient image loading
            Glide.with(itemView.context)
                .load(item.imageUrl)
                .placeholder(R.drawable.placeholder)
                .into(thumbnailImageView)
        }
    }

    override fun onCreateViewHolder(parent: ViewGroup, viewType: Int): ViewHolder {
        val view = LayoutInflater.from(parent.context)
            .inflate(R.layout.item_optimized, parent, false)
        return ViewHolder(view)
    }

    override fun onBindViewHolder(holder: ViewHolder, position: Int) {
        holder.bind(items[position])
    }

    override fun getItemCount() = items.size
}

// In your Fragment or Activity
recyclerView.apply {
    // Enable hardware acceleration
    setLayerType(View.LAYER_TYPE_HARDWARE, null)

    // Set fixed size if content doesn't change height
    setHasFixedSize(true)

    // Use appropriate layout manager
    layoutManager = LinearLayoutManager(context).apply {
        // Prefetch items outside viewport
        initialPrefetchItemCount = 4
    }

    adapter = OptimizedAdapter(items)
}
Reduce View Hierarchy Complexity
Deep view hierarchies kill performance. On Android, use ConstraintLayout to flatten hierarchies. On iOS, leverage UIStackView and layout anchors efficiently.
// Android: Flatten with ConstraintLayout
<androidx.constraintlayout.widget.ConstraintLayout
android:layout_width="match_parent"
android:layout_height="wrap_content">
<ImageView
android:id="@+id/thumbnail"
android:layout_width="80dp"
android:layout_height="80dp"
app:layout_constraintStart_toStartOf="parent"
app:layout_constraintTop_toTopOf="parent" />
<TextView
android:id="@+id/title"
android:layout_width="0dp"
android:layout_height="wrap_content"
app:layout_constraintStart_toEndOf="@id/thumbnail"
app:layout_constraintEnd_toEndOf="parent"
app:layout_constraintTop_toTopOf="@id/thumbnail" />
</androidx.constraintlayout.wi
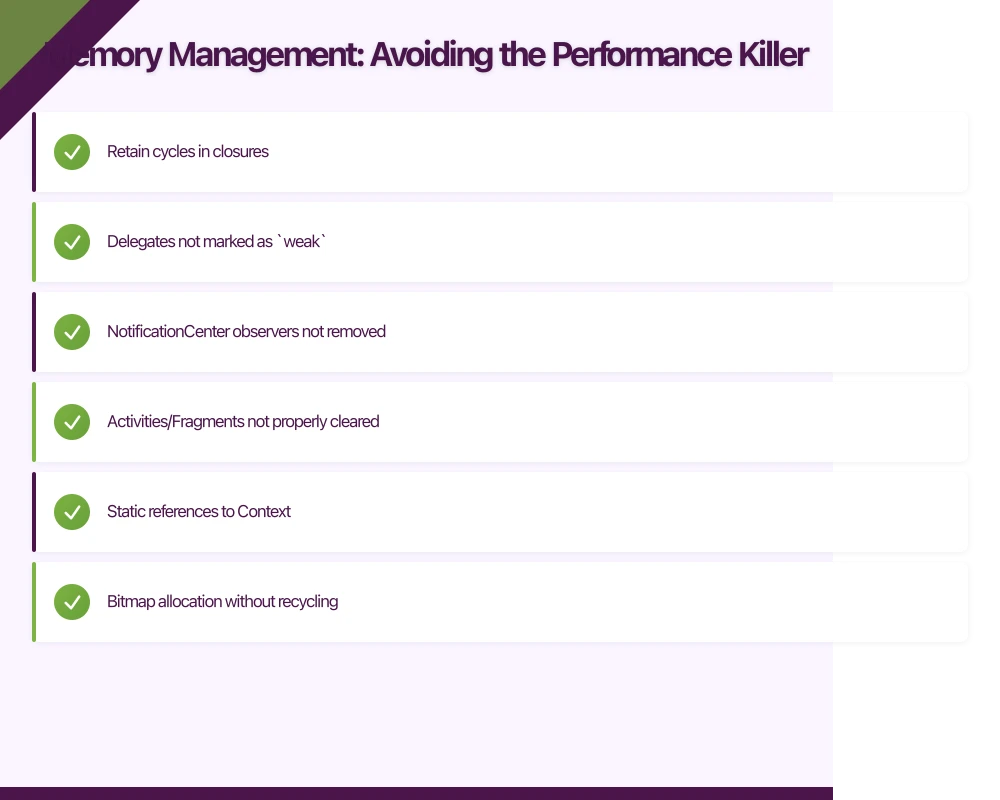
dget.ConstraintLayout>Memory Management: Avoiding the Performance Killer
Memory pressure forces garbage collection (Android) or memory warnings (iOS), both of which cause frame drops and app termination.
iOS: Identify Memory Leaks with Instruments
Use Xcode Instruments (Allocations and Leaks templates) to profile memory usage. Common leak sources include:
- Retain cycles in closures
- Delegates not marked as
weak - NotificationCenter observers not removed
class ImageGalleryViewController: UIViewController {
    private var imageCache: [Int: UIImage] = [:]

    override func viewDidLoad() {
        super.viewDidLoad()

        // [x] BAD: Creates retain cycle
        NotificationCenter.default.addObserver(forName: .imageLoaded, object: nil, queue: .main) { notification in
            self.handleImageLoaded(notification)
        }

        // [x] GOOD: Use weak self
        NotificationCenter.default.addObserver(forName: .imageLoaded, object: nil, queue: .main) { [weak self] notification in
            self?.handleImageLoaded(notification)
        }
    }

    deinit {
        // Always remove observers
        NotificationCenter.default.removeObserver(self)
    }

    func handleImageLoaded(_ notification: Notification) {
        // Implementation
    }

    // Implement aggressive cache eviction
    override func didReceiveMemoryWarning() {
        super.didReceiveMemoryWarning()
        imageCache.removeAll()
    }
}
Android: Profile with Memory Profiler
Android Studio’s Memory Profiler shows real-time memory usage and identifies leaks. Common issues include:
- Activities/Fragments not properly cleared
- Static references to Context
- Bitmap allocation without recycling
class ImageGalleryActivity : AppCompatActivity() {
    private val imageCache = LruCache<String, Bitmap>(
        (Runtime.getRuntime().maxMemory() / 1024 / 8).toInt() // Use 1/8 of available memory
    )

    override fun onCreate(savedInstanceState: Bundle?) {
        super.onCreate(savedInstanceState)

        // Monitor memory usage
        val activityManager = getSystemService(Context.ACTIVITY_SERVICE) as ActivityManager
        val memoryInfo = ActivityManager.MemoryInfo()
        activityManager.getMemoryInfo(memoryInfo)

        if (memoryInfo.lowMemory) {
            // Reduce memory footprint
            imageCache.evictAll()
        }
    }

    private fun loadImageOptimized(url: String, imageView: ImageView) {
        // Check cache first
        imageCache.get(url)?.let { cachedBitmap ->
            imageView.setImageBitmap(cachedBitmap)
            return
        }

        // Load with proper sampling
        Glide.with(this)
            .load(url)
            .override(imageView.width, imageView.height) // Sample to view size
            .into(imageView)
    }

    override fun onTrimMemory(level: Int) {
        super.onTrimMemory(level)
        when (level) {
            ComponentCallbacks2.TRIM_MEMORY_UI_HIDDEN,
            ComponentCallbacks2.TRIM_MEMORY_BACKGROUND -> {
                // User left app, clear cache
                imageCache.evictAll()
            }
        }
    }
}
Bitmap Optimization
Images are the biggest memory consumers in most apps. Always downsample to the display size:
// iOS: Downsample images efficiently
func downsampleImage(at url: URL, to targetSize: CGSize) -> UIImage? {
let imageSourceOptions = [kCGImageSourceShouldCache: false] as CFDictionary
guard let imageSource = CGImageSourceCreateWithURL(url as CFURL, imageSourceOptions) else {
return nil
}
let maxDimension = max(targetSize.width, targetSize.height)
let downsampleOptions = [
kCGImageSourceCreateThumbnailFromImageAlways: true,
kCGImageSourceShouldCacheImmediately: true,
kCGImageSourceCreateThumbnailWithTransform: true,
kCGImageSourceThumbnailMaxPixelSize: maxDimension
] as CFDictionary
guard let downsampledImage = CGImageSourceCreateThumbnailAtIndex(imageSource, 0, downsampleOptions) else {
return nil
}
return UIImage(c
gImage: downsampledImage)
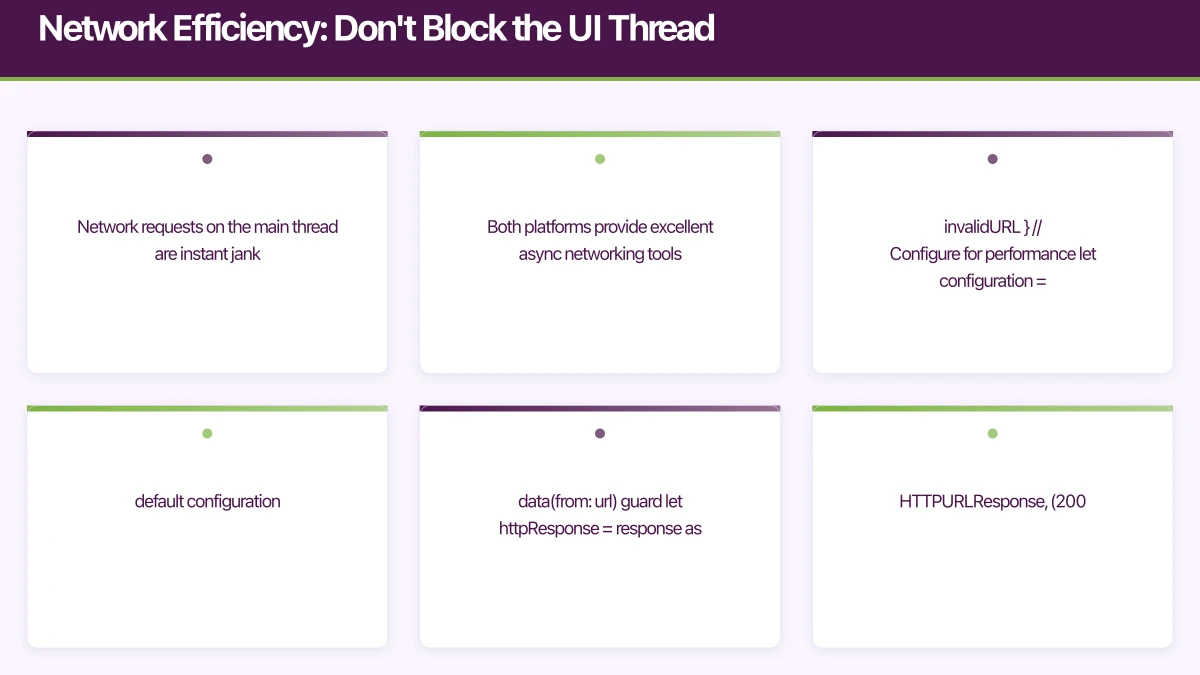
}Network Efficiency: Don’t Block the UI Thread
Network requests on the main thread are instant jank. Both platforms provide excellent async networking tools.
iOS: URLSession with Async/Await
iOS 15+ supports modern async/await patterns for URLSession:
class APIClient {
    func fetchData<T: Decodable>(from endpoint: String) async throws -> T {
        guard let url = URL(string: endpoint) else {
            throw APIError.invalidURL
        }

        // Configure for performance
        let configuration = URLSessionConfiguration.default
        configuration.urlCache = URLCache(
            memoryCapacity: 20_000_000,  // 20 MB memory cache
            diskCapacity: 100_000_000,   // 100 MB disk cache
            diskPath: nil
        )
        configuration.requestCachePolicy = .returnCacheDataElseLoad

        let session = URLSession(configuration: configuration)

        // Non-blocking async call
        let (data, response) = try await session.data(from: url)

        guard let httpResponse = response as? HTTPURLResponse,
              (200...299).contains(httpResponse.statusCode) else {
            throw APIError.serverError
        }

        return try JSONDecoder().decode(T.self, from: data)
    }
}

// Usage in view controller
func loadUserData() {
    Task {
        do {
            let user: User = try await apiClient.fetchData(from: "https://api.example.com/user")
            // Update UI on main thread
            await MainActor.run {
                self.updateUI(with: user)
            }
        } catch {
            print("Error loading user data: \(error)")
        }
    }
}
Android: Retrofit with Coroutines
Retrofit 2.x with Kotlin Coroutines is the modern standard:
interface ApiService {
    @GET("users/{id}")
    suspend fun getUser(@Path("id") userId: String): User

    @GET("posts")
    suspend fun getPosts(): List<Post>
}

class ApiClient {
    private val retrofit = Retrofit.Builder()
        .baseUrl("https://api.example.com/")
        .addConverterFactory(GsonConverterFactory.create())
        .client(
            OkHttpClient.Builder()
                .cache(
                    Cache(
                        directory = File(context.cacheDir, "http_cache"),
                        maxSize = 50L * 1024L * 1024L // 50 MB
                    )
                )
                .build()
        )
        .build()

    private val apiService = retrofit.create(ApiService::class.java)

    suspend fun fetchUser(userId: String): Result<User> {
        return try {
            val user = apiService.getUser(userId)
            Result.success(user)
        } catch (e: Exception) {
            Result.failure(e)
        }
    }
}

// Usage in Activity/Fragment with ViewModel
class UserViewModel(private val apiClient: ApiClient) : ViewModel() {
    private val _userState = MutableLiveData<User>()
    val userState: LiveData<User> = _userState

    fun loadUser(userId: String) {
        viewModelScope.launch {
            // Runs on background thread
            apiClient.fetchUser(userId).onSuccess { user ->
                // Update UI on main thread
                _userState.value = user
            }
        }
    }
}
Profiling Tools: Measure Before Optimizing
Premature optimization wastes time. Profile first, identify bottlenecks, then optimize.
iOS: Xcode Instruments
The Time Profiler template shows exactly where your app spends CPU time:
- Product > Profile (⌘I)
- Select Time Profiler
- Record while using your app
- Analyze the call tree (focus on heaviest stack traces)
Look for:
- Functions consuming over 10ms on main thread
- Repeated allocations in tight loops
- Synchronous I/O operations
Android: Systrace and Perfetto
Systrace (now Perfetto) provides system-level performance insights:
# Capture 10-second trace
python systrace.py --time=10 -o trace.html sched gfx view wm am app dalvik

# Or use Android Studio CPU Profiler
# Run > Profile 'app' > CPU
The timeline view shows:
- UI thread activity (should be minimal)
- RenderThread utilization
- Frame boundaries and dropped frames
- Method tracing for specific bottlenecks
Key Metrics to Track
Monitor these performance indicators:
| Metric | Target | Tools |
|---|---|---|
| Frame time | less than 16ms (60fps) | Instruments, Perfetto |
| Startup time | less than 2s cold start | Time Profiler, App Startup |
| Memory usage | less than 150MB baseline | Memory Profiler, Leaks |
| Network latency | less than 500ms API calls | Network Link Conditioner |
| Battery drain | less than 5% per hour active use | Energy Profiler, Battery |
Practical Performance Checklist
Before shipping your next app update, verify:
Rendering:
- No main thread blocking operations over 16ms
- RecyclerView/UITableView cells properly recycled
- View hierarchy depth less than 10 levels
- Images downsampled to display size
- Animations use hardware acceleration
Memory:
- No memory leaks in Instruments/Memory Profiler
- Proper cache eviction on memory warnings
- Bitmaps released when not visible
- No retain cycles in closures/listeners
Network:
- All network calls async/non-blocking
- HTTP caching configured
- Offline state handled gracefully
- Request deduplication implemented
Profiling:
- Time Profiler shows no red flags
- Systrace/Perfetto confirms 60fps during key flows
- Memory usage stable over 10-minute session
- Battery impact within acceptable range
Conclusion: Performance is a Feature
Users don’t distinguish between “bad code” and “bad design”—they just know your app feels slow. Achieving consistent 60fps performance requires understanding the rendering pipeline, managing memory intelligently, and using profiling tools to measure real-world bottlenecks.
The techniques covered here—optimized list rendering, proper memory management, async networking, and systematic profiling—form the foundation of performant mobile apps. Implement them incrementally, measure the impact, and your users will notice the difference.
For Australian startups building mobile apps, performance isn’t just technical polish—it’s a competitive advantage. In a market where user acquisition costs are high, retention through great UX is essential. Start with the profiling tools, identify your worst bottlenecks, and fix them systematically.
Building a high-performance mobile app? At eawesome, we architect apps for 60fps performance from day one. Get in touch to discuss your project.
A dedicated website amplifies your app’s reach. Cosmos Web Tech builds SEO-optimised sites that turn Google searches into app installs.
Awesome Apps operates under the Ganda Tech Services umbrella, delivering end-to-end technology solutions for Australian businesses.
Talk to a Sydney app developer — free.
30 minutes. We'll tell you what your app needs, how long it takes, and what it costs. Real answers, no sales pitch.
Book Free App Strategy Call →Free · 30 minutes · No obligation