Mobile App Performance Benchmarking and Profiling
Performance problems are the silent killers of mobile apps. Users do not file bug reports about sluggish scrolling or slow screen transitions — they simply stop using your app. Studies consistently show that a 100ms delay in response time reduces user satisfaction measurably, and apps that feel slow see significantly higher uninstall rates.
The challenge is that performance issues are invisible during normal development. Your test data is small, your development device is a flagship, and you are not running 47 background apps like your users are. Systematic profiling and benchmarking reveal issues before your users feel them.
This guide covers the tools, techniques, and metrics that keep your mobile app fast.
Performance Metrics That Matter
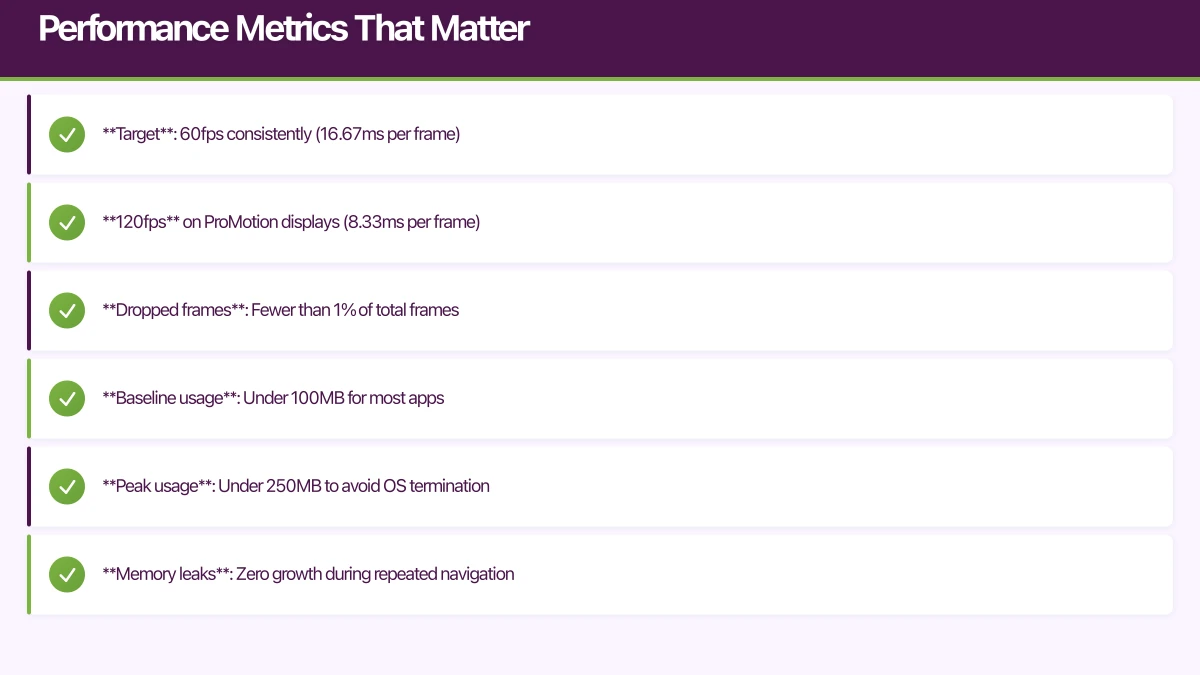
Before profiling, define what “fast” means for your app:
Frame Rate
- Target: 60fps consistently (16.67ms per frame)
- 120fps on ProMotion displays (8.33ms per frame)
- Dropped frames: Fewer than 1% of total frames
Memory
- Baseline usage: Under 100MB for most apps
- Peak usage: Under 250MB to avoid OS termination
- Memory leaks: Zero growth during repeated navigation
App Launch
- Cold start: Under 1 second to interactive content
- Warm start: Under 500ms
- Resume: Under 200ms
Network
- API response handling: Under 100ms for UI update after data arrives
- Image loading: Progressive display within 500ms
Battery
- CPU usage: Under 5% when idle
- Background activity: Minimal, compliant with OS guidelines
iOS Profiling with Xcode In
 struments
Instruments is the most powerful mobile profiling tool available. Here are the templates that matter most:
Time Profiler
Identifies which functions consume the most CPU time:
- Open Instruments (Xcode menu or Cmd+I)
- Select “Time Profiler”
- Profile on a physical device (simulators have different performance characteristics)
- Navigate through your app reproducing the slow scenario
- Analyse the call tree
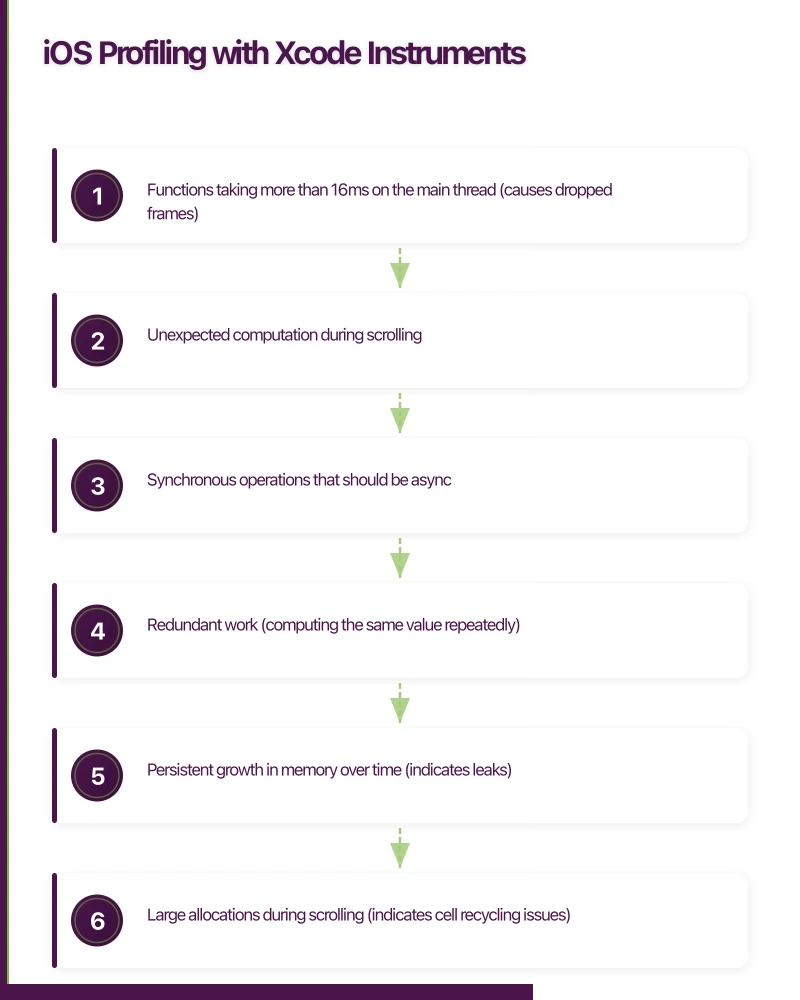
What to look for:
- Functions taking more than 16ms on the main thread (causes dropped frames)
- Unexpected computation during scrolling
- Synchronous operations that should be async
- Redundant work (computing the same value repeatedly)
// Use signposts to mark regions of interest
import os

let signpostLog = OSLog(subsystem: "com.yourapp", category: "Performance")

func loadProducts() async {
    os_signpost(.begin, log: signpostLog, name: "Load Products")

    let products = try await repository.fetchAll()

    os_signpost(.event, log: signpostLog, name: "Load Products",
                "Fetched %d products", products.count)

    await processProducts(products)

    os_signpost(.end, log: signpostLog, name: "Load Products")
}
Signposts appear in Instruments as named regions, making it easy to correlate profiling data with specific operations.
Allocations
Track memory usage and identify leaks:
What to look for:
- Persistent growth in memory over time (indicates leaks)
- Large allocations during scrolling (indicates cell recycling issues)
- Retain cycles between objects
// Common retain cycle in closures
class ViewController: UIViewController {
    var viewModel: ViewModel?

    func setupBindings() {
        // BAD: strong reference cycle
        viewModel?.onUpdate = {
            self.updateUI() // 'self' is captured strongly
        }

        // GOOD: weak capture
        viewModel?.onUpdate = { [weak self] in
            self?.updateUI()
        }
    }
}
Core Animation
Profiles rendering performance:
- Color Blended Layers: Shows where the GPU is blending transparent layers (expensive)
- Color Offscreen-Rendered: Shows views rendered offscreen before compositing (expensive)
- Color Misaligned Images: Shows images that are not pixel-aligned (causes blurring and extra work)
Energy Log
Measures battery impact:
- CPU usage over time
- Network activity patterns
- GPS usage
- Display brightness impact
Profile during typical usage scenarios and overnight idle to ensure your app is not draining battery in the background.
Android Profil
ing with Android Studio
CPU Profiler
Android Studio’s CPU Profiler captures method traces and shows where CPU time is spent:
// Use Trace API for custom sections
import android.os.Trace

fun loadProducts() {
    Trace.beginSection("loadProducts")

    Trace.beginSection("fetchFromNetwork")
    val products = repository.fetchAll()
    Trace.endSection()

    Trace.beginSection("processAndDisplay")
    processProducts(products)
    Trace.endSection()

    Trace.endSection()
}
These sections appear in the CPU Profiler timeline, correlating execution with your code.
Memory Profiler
Track allocations, identify leaks, and capture heap dumps:
// Common Android memory leak: Activity reference in static context
class LeakyAnalytics {
    companion object {
        // BAD: holds Activity reference beyond its lifecycle
        var activityContext: Context? = null

        // GOOD: use application context for long-lived references
        var appContext: Context? = null
    }
}

// Common leak: unregistered listeners
class LocationService(private val context: Context) {
    private var locationCallback: LocationCallback? = null

    fun startTracking() {
        locationCallback = object : LocationCallback() {
            override fun onLocationResult(result: LocationResult) {
                // Process location
            }
        }
        fusedLocationClient.requestLocationUpdates(
            locationRequest, locationCallback!!, Looper.getMainLooper()
        )
    }

    // MUST call this to prevent leak
    fun stopTracking() {
        locationCallback?.let {
            fusedLocationClient.removeLocationUpdates(it)
        }
        locationCallback = null
    }
}
Network Profiler
Visualises network requests with timing, size, and response details. Look for:
- Redundant requests (same data fetched multiple times)
- Large payloads that could be paginated
- Requests that block UI rendering
Layout Inspector
Examine the view hierarchy for complexity. Deep hierarchies with more than 10 levels indicate potential layout performance issues. With Compose, also check for unnecessary recompositions.
Automated Benchmarking
iOS XCTest Performance Tests
class PerformanceTests: XCTestCase {
    func testProductListScrollPerformance() throws {
        let app = XCUIApplication()
        app.launch()

        let productList = app.collectionViews["product_list"]

        measure(metrics: [
            XCTOSSignpostMetric.scrollDraggingMetric,
            XCTOSSignpostMetric.scrollDecelerationMetric,
            XCTClockMetric(),
            XCTMemoryMetric(),
            XCTCPUMetric()
        ]) {
            productList.swipeUp(velocity: .fast)
            productList.swipeDown(velocity: .fast)
        }
    }

    func testAppLaunchPerformance() {
        measure(metrics: [XCTApplicationLaunchMetric()]) {
            XCUIApplication().launch()
        }
    }

    func testProductSearchPerformance() {
        let viewModel = ProductSearchViewModel(
            repository: MockRepository(productCount: 10000)
        )

        measure {
            viewModel.search("running shoes")
        }
    }
}
Android Macrobenchmark
@RunWith(AndroidJUnit4::class)
class StartupBenchmark {
    @get:Rule
    val benchmarkRule = MacrobenchmarkRule()

    @Test
    fun startupCompilationNone() = benchmarkRule.measureRepeated(
        packageName = "com.au.yourapp",
        metrics = listOf(StartupTimingMetric()),
        iterations = 5,
        startupMode = StartupMode.COLD
    ) {
        pressHome()
        startActivityAndWait()
    }

    @Test
    fun scrollProductList() = benchmarkRule.measureRepeated(
        packageName = "com.au.yourapp",
        metrics = listOf(FrameTimingMetric()),
        iterations = 5
    ) {
        startActivityAndWait()

        val list = device.findObject(By.res("product_list"))
        list.setGestureMargin(device.displayWidth / 5)

        repeat(3) {
            list.fling(Direction.DOWN)
            device.waitForIdle()
        }
    }
}
Android Microbenchmark
For testing specific functions:
@RunWith(AndroidJUnit4::class)
class DatabaseBenchmark {
    @get:Rule
    val benchmarkRule = BenchmarkRule()

    @Test
    fun queryProducts() {
        val db = Room.inMemoryDatabaseBuilder(
            ApplicationProvider.getApplicationContext(),
            AppDatabase::class.java
        ).build()

        // Seed data
        val products = (1..10000).map { Product(id = it.toString(), name = "Product $it") }
        db.productDao().insertAll(products)

        benchmarkRule.measureRepeated {
            db.productDao().searchByName("Product 500")
        }
    }
}
Continuous Performance Monitoring
In-Production Metrics
Track performance metrics from real user devices:
class PerformanceMonitor {
    static let shared = PerformanceMonitor()

    func trackScreenRender(screen: String, duration: TimeInterval) {
        if duration > 0.5 { // Flag slow renders
            analytics.track("slow_screen_render", properties: [
                "screen": screen,
                "duration_ms": Int(duration * 1000),
                "device_model": deviceModel,
                "os_version": osVersion,
                "available_memory_mb": availableMemoryMB
            ])
        }
    }

    func trackScrollPerformance(screen: String, droppedFrames: Int, totalFrames: Int) {
        let dropRate = Double(droppedFrames) / Double(totalFrames)
        if dropRate > 0.05 { // More than 5% dropped frames
            analytics.track("scroll_jank", properties: [
                "screen": screen,
                "drop_rate": dropRate,
                "device_model": deviceModel
            ])
        }
    }
}
Performance Budgets
Set concrete limits and enforce them in CI:
# performance-budgets.yml
app_launch:
  cold_start_p50: 800ms
  cold_start_p95: 1500ms

screen_transitions:
  p50: 300ms
  p95: 500ms

scroll_performance:
  dropped_frame_rate: 0.02  # 2% maximum

memory:
  baseline: 80MB
  peak: 200MB

bundle_size:
  ios: 30MB
  android: 25MB
Regression Detection
Run benchmarks in your CI pipeline and fail builds that regress:
# Compare benchmark results against baseline
current_startup=$(get_benchmark_result "startup_time")
baseline_startup=$(get_baseline "startup_time")
threshold=1.10  # 10% regression threshold

if (( $(echo "$current_startup > $baseline_startup * $threshold" | bc -l) )); then
    echo "FAIL: Startup time regressed from ${baseline_startup}ms to ${current_startup}ms"
    exit 1
fi
Common Performance Pitfalls
- Main thread network calls. Always fetch data on background threads.
- Oversized images. Decode images at the display size, not the file size.
- Excessive view hierarchy depth. Flatten layouts where possible.
- Synchronous JSON parsing of large payloads. Stream-parse or background-parse.
- Missing list recycling. Use LazyColumn/LazyVStack/RecyclerView for long lists.
- Logging in production. Remove or disable verbose logging in release builds.
Performance is not a one-time fix — it is a continuous practice. Build profiling into your development routine, automate benchmarks in CI, and monitor real-user performance in production. The apps that feel fast are the apps that keep users coming back.
Need help optimising your mobile app’s performance? Our team at eawesome builds fast, responsive applications for Australian businesses.
Pair your iOS or Android app with a website that ranks. Cosmos Web Tech handles web design and search optimisation for app businesses across Sydney.
Ganda Tech Services brings together cloud infrastructure, web development, and mobile app expertise to help Australian businesses thrive in the digital economy.
Talk to a Sydney app developer — free.
30 minutes. We'll tell you what your app needs, how long it takes, and what it costs. Real answers, no sales pitch.
Book Free App Strategy Call →Free · 30 minutes · No obligation