Mobile App Performance Optimisation Techniques
Performance is a feature. Users notice when an app feels sluggish, and they leave. Research consistently shows that even 100 milliseconds of latency affects user perception. A slow app does not just frustrate users; it costs you retention, engagement, and revenue.
This guide covers the optimisation techniques that make the biggest difference in real-world mobile apps. We focus on measurable improvements, not micro-optimisations that look clever in benchmarks but make no difference to users.
Measuring Before Optimising
Never optimise without measuring. Your intuition about what is slow is often wrong. Profile first, then target the actual bottlenecks.
iOS Profiling
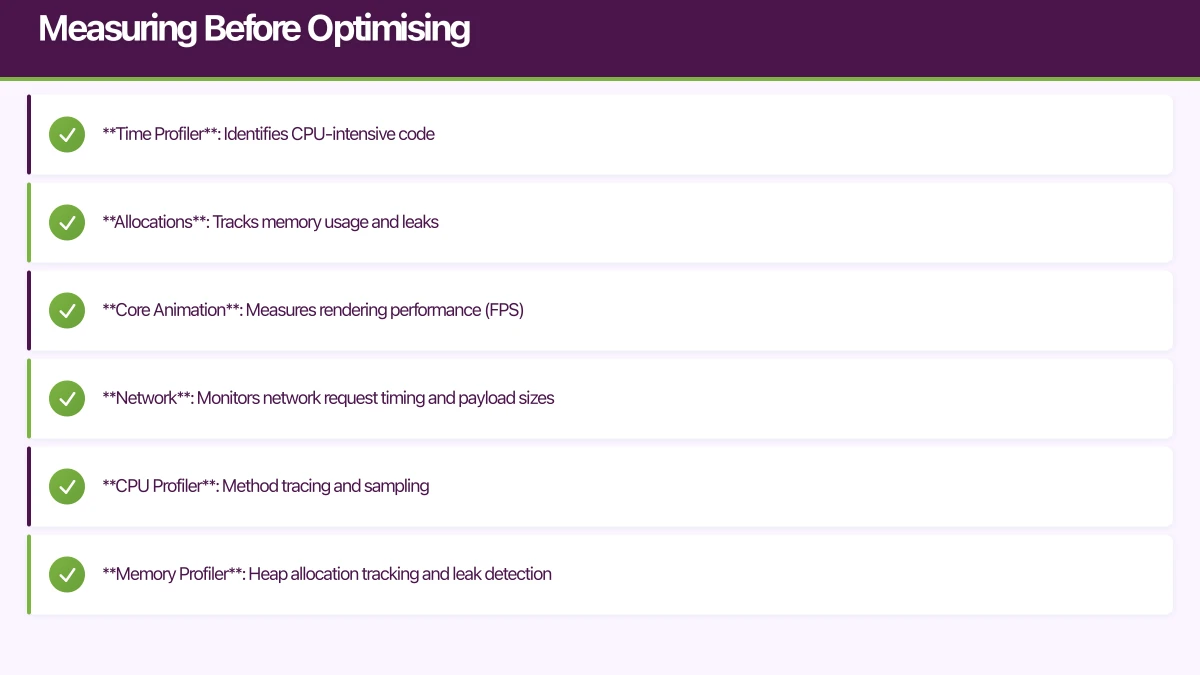
Instruments is the primary profiling tool for iOS:
- Time Profiler: Identifies CPU-intensive code
- Allocations: Tracks memory usage and leaks
- Core Animation: Measures rendering performance (FPS)
- Network: Monitors network request timing and payload sizes
Android Profiling
Android Studio Profiler provides:
- CPU Profiler: Method tracing and sampling
- Memory Profiler: Heap allocation tracking and leak detection
- Network Profiler: Request timeline and payload inspection
- Energy Profiler: Battery usage analysis
React Native Profiling
- Flipper: The official debugging tool, includes performance monitoring
- React DevTools: Component render profiling
- Systrace: Low-level system trace for diagnosing jank
Flutter Profiling
- Flutter DevTools: Widget rebuild tracking, timeline view, memory analysis
- Performance overlay: Real-time FPS display
- Run in profile mode (
flutter run --profile) for accurate measurements
Startup Time Optimisation
App startup time is the first impression. Users expect apps to be interactive within 2 seconds.
Reduce Launch Work
Audit everything that happens during app launch. Common culprits:
- SDK initialisations: Analytics, crash reporting, and third-party SDKs often initialise synchronously on launch. Defer non-critical SDKs.
- Database migrations: Run schema migrations asynchronously and show a loading state if needed.
- Network requests: Do not block the UI on network data. Show cached data or a skeleton screen while fetching.
- Large asset loading: Defer loading of assets that are not needed for the initial screen.
// iOS: Defer non-critical initialisation
class AppDelegate: UIResponder, UIApplicationDelegate {
    func application(
        _ application: UIApplication,
        didFinishLaunchingWithOptions launchOptions: [UIApplication.LaunchOptionsKey: Any]?
    ) -> Bool {
        // Critical: Configure immediately
        FirebaseApp.configure()

        // Deferred: Initialize after first frame
        DispatchQueue.main.async {
            self.initializeAnalytics()
            self.initializeCrashReporting()
            self.prefetchData()
        }

        return true
    }
}
iOS-Specific Startup Optimisations
- Reduce dylib loading: Each dynamic library adds to launch time. Minimise third-party frameworks or use static linking.
- Optimise the main storyboard: A complex initial storyboard takes time to inflate. Use a simple launch screen.
- Pre-warm critical paths: If you know the user will navigate to a specific screen, preload its data during launch.
Android-Specific Startup Optimisations
- Avoid heavy Application.onCreate(): Keep it minimal. Use lazy initialisation.
- Use App Startup library: Android Jetpack’s App Startup library enables efficient, ordered initialisation of components.
- Enable R8/ProGuard: Code shrinking removes unused code, reducing DEX file size and class loading time.
// Android: Lazy SDK initialisation with App Startup
class AnalyticsInitializer : Initializer<AnalyticsService> {
    override fun create(context: Context): AnalyticsService {
        return AnalyticsService.initialize(context)
    }

    override fun dependencies(): List<Class<out Initializer<*>>> {
        return emptyList()
    }
}
Rendering Performa
 nce
nce
The goal is 60 frames per second (16.67 milliseconds per frame). Dropped frames cause visible jank.
Avoid Unnecessary Rebuilds
The most common rendering performance issue is rebuilding widgets or views that have not changed.
Flutter: Use const constructors, extract widgets into separate classes, and use Selector or context.select() with Provider to rebuild only affected widgets.
// Bad: Entire list rebuilds when any task changes
Consumer<TaskProvider>(
  builder: (context, provider, _) {
    return Column(
      children: [
        Text('Count: ${provider.totalCount}'), // Only needs count
        TaskList(tasks: provider.tasks),        // Needs full list
      ],
    );
  },
)

// Good: Separate consumers for different data
Column(
  children: [
    Selector<TaskProvider, int>(
      selector: (_, provider) => provider.totalCount,
      builder: (_, count, __) => Text('Count: $count'),
    ),
    Consumer<TaskProvider>(
      builder: (_, provider, __) => TaskList(tasks: provider.tasks),
    ),
  ],
)
React Native: Use React.memo() for functional components, implement shouldComponentUpdate for class components, and use useCallback and useMemo to prevent unnecessary re-renders.
// React Native: Optimised list item
const TaskItem = React.memo(({ task, onToggle }) => {
  return (
    <TouchableOpacity onPress={() => onToggle(task.id)}>
      <Text>{task.title}</Text>
    </TouchableOpacity>
  );
});

// Stable callback reference
const TaskList = ({ tasks }) => {
  const handleToggle = useCallback((id) => {
    dispatch(toggleTask(id));
  }, [dispatch]);

  return (
    <FlatList
      data={tasks}
      keyExtractor={(item) => item.id}
      renderItem={({ item }) => (
        <TaskItem task={item} onToggle={handleToggle} />
      )}
    />
  );
};
List Performance
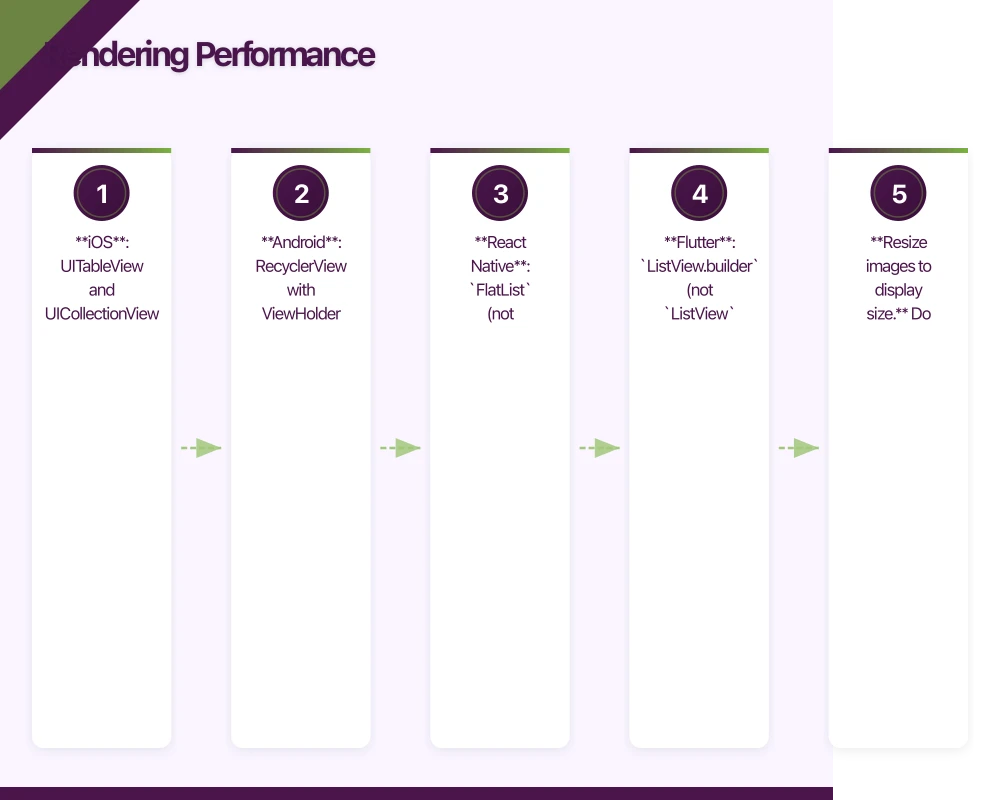
Long lists are common performance bottlenecks. Use virtualised lists that render only visible items:
- iOS: UITableView and UICollectionView (virtualized by default). In SwiftUI, use
LazyVStackorList. - Android: RecyclerView with ViewHolder pattern. In Compose, use
LazyColumn. - React Native:
FlatList(notScrollViewfor long lists). - Flutter:
ListView.builder(notListViewwith all children).
Image Optimisation
Images are often the heaviest assets on screen:
- Resize images to display size. Do not load a 4000x3000 pixel image to display at 200x150 points.
- Use appropriate formats. WebP offers smaller file sizes than JPEG/PNG with comparable quality. HEIC is excellent on iOS.
- Cache aggressively. Use URLCache on iOS, OkHttp cache on Android, or libraries like SDWebImage/Glide.
- Lazy load off-screen images. Only load images as they approach the visible area.
// Android: Glide with appropriate sizing
Glide.with(context)
    .load(imageUrl)
    .override(200, 200)     // Load at display size
    .centerCrop()
    .diskCacheStrategy(DiskCacheStrategy.ALL)
    .into(imageView)
Memory Manageme
nt
Memory pressure causes crashes, background termination, and degraded performance.
Identify and Fix Leaks
Memory leaks are insidious. They do not cause immediate crashes but gradually degrade performance until the system kills your app.
Common leak sources:
- Strong reference cycles (retain cycles) in closures
- Uncancelled timers and observers
- Unreleased resources (database connections, file handles)
- Cached data that grows without bounds
// iOS: Weak self in closures to prevent retain cycles
class TaskDetailViewController: UIViewController {
    var task: Task?

    func loadDetails() {
        // BAD: Strong reference to self
        apiClient.fetchDetails(taskId: task?.id ?? "") { result in
            self.updateUI(with: result) // Retains self
        }

        // GOOD: Weak reference to self
        apiClient.fetchDetails(taskId: task?.id ?? "") { [weak self] result in
            self?.updateUI(with: result) // Does not retain self
        }
    }
}
Manage Cache Size
Caching improves performance but consumes memory. Implement cache eviction:
// React Native: LRU cache with size limit
class LRUCache {
  constructor(maxSize) {
    this.maxSize = maxSize;
    this.cache = new Map();
  }

  get(key) {
    if (this.cache.has(key)) {
      const value = this.cache.get(key);
      // Move to end (most recently used)
      this.cache.delete(key);
      this.cache.set(key, value);
      return value;
    }
    return null;
  }

  set(key, value) {
    if (this.cache.has(key)) {
      this.cache.delete(key);
    } else if (this.cache.size >= this.maxSize) {
      // Remove least recently used (first item)
      const firstKey = this.cache.keys().next().value;
      this.cache.delete(firstKey);
    }
    this.cache.set(key, value);
  }
}
Network Optimisation
Reduce Payload Size
- Enable gzip/Brotli compression on your API
- Request only needed fields (sparse fieldsets)
- Use pagination for list endpoints
- Compress images before upload
Reduce Request Count
- Batch related requests where possible
- Use compound documents to include related resources
- Cache responses with appropriate HTTP cache headers
- Pre-fetch data the user is likely to need next
Handle Poor Connectivity
Australian users frequently encounter poor connectivity. Design for it:
- Show cached data immediately, update when fresh data arrives
- Implement request timeouts (10 seconds for connection, 30 seconds for response)
- Use exponential backoff for retries
- Queue operations when offline and sync when reconnected
App Size Optimisation
Smaller apps download faster, install faster, and are less likely to be deleted when users need storage space.
iOS Size Reduction
- Enable bitcode: Lets Apple optimise for specific device architectures
- Use asset catalogs: Automatically provides device-appropriate assets
- Strip unused code: Enable dead code stripping in build settings
- Audit dependencies: Remove unused frameworks and libraries
- Use on-demand resources: Download large assets only when needed
Android Size Reduction
- Enable R8/ProGuard: Removes unused code and resources
- Use Android App Bundle: Google Play generates optimised APKs per device configuration
- Compress PNG assets: Use WebP format where possible
- Use vector drawables: Replace raster icons with vectors
- Split APKs by ABI: Separate native libraries by architecture
// Android: Enable bundle and code shrinking
android {
    bundle {
        language { enableSplit = true }
        density { enableSplit = true }
        abi { enableSplit = true }
    }

    buildTypes {
        release {
            minifyEnabled true
            shrinkResources true
            proguardFiles getDefaultProguardFile('proguard-android-optimize.txt'),
                'proguard-rules.pro'
        }
    }
}
Battery Optimisation
Battery drain is the silent performance killer. Users may not know your app is responsible, but they will notice their phone dying early.
- Minimise background activity. Use background processing APIs (WorkManager on Android, BGTaskScheduler on iOS) responsibly.
- Batch network requests. Waking the radio for a single request is expensive. Batch operations together.
- Reduce location tracking precision. If you only need city-level accuracy, do not request GPS precision.
- Avoid polling. Use push notifications or WebSockets instead of periodic polling.
Performance Budgets
Set measurable performance targets and track them:
| Metric | Target |
|---|---|
| App startup (cold) | Under 2 seconds |
| Screen transition | Under 300 milliseconds |
| Frame rate | 60fps (under 16.67ms per frame) |
| Time to interactive | Under 3 seconds |
| API response display | Under 1 second |
| Memory usage (idle) | Under 100MB |
| App size (download) | Under 50MB |
Monitor these metrics in CI/CD and flag regressions before they reach production.
Performance optimisation is an ongoing practice, not a one-time task. At eawesome, we build performance monitoring into our development process from day one, ensuring our clients’ apps stay fast as they grow.
Every great app needs reliable cloud infrastructure behind it. Cloud Geeks provides managed AWS and Azure hosting for mobile backends.
Ashish Ganda is the founder of Ganda Tech Services, a Sydney-based technology consultancy helping Australian businesses grow through cloud, web, and mobile solutions.
Talk to a Sydney app developer — free.
30 minutes. We'll tell you what your app needs, how long it takes, and what it costs. Real answers, no sales pitch.
Book Free App Strategy Call →Free · 30 minutes · No obligation